HOT TOPICS LIST
- MACD
- Fibonacci
- RSI
- Gann
- ADXR
- Stochastics
- Volume
- Triangles
- Futures
- Cycles
- Volatility
- ZIGZAG
- MESA
- Retracement
- Aroon
INDICATORS LIST
LIST OF TOPICS
PRINT THIS ARTICLE
by Paolo Pezzutti
A false breakout to the upside for ExxonMobil brings prices back into the trading range.
Position: N/A
Paolo Pezzutti
Author of the book "Trading the US Markets - A Comprehensive Guide to US Markets for International Traders and Investors" - Harriman House (July 2008)
PRINT THIS ARTICLE
TECHNICAL ANALYSIS
ExxonMobil: A Successful Oil Company
09/06/05 11:27:32 AMby Paolo Pezzutti
A false breakout to the upside for ExxonMobil brings prices back into the trading range.
Position: N/A
| ExxonMobil Corp. (XOM) is among the three companies whose refineries will be receiving crude oil from the US Strategic Petroleum Reserve, a move aimed at keeping refining operations going despite severe supply disruptions. |
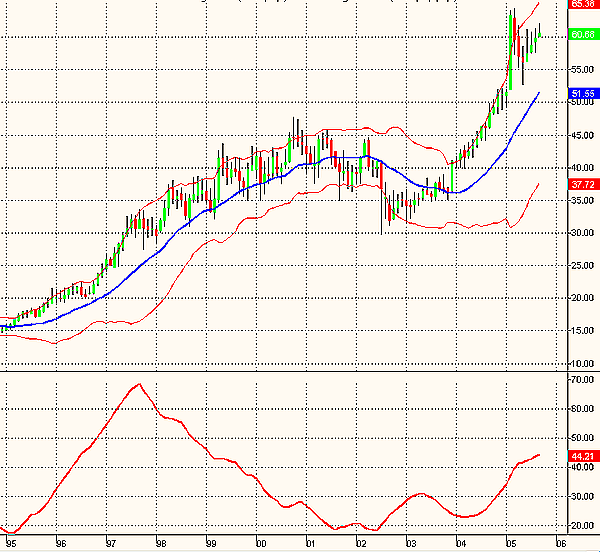
| The ADX (average directional movement index) attempts to measure the trending quality of a security independent of direction. The greater the ADX value, the stronger a security is trending. Traditionally, values above 30 indicate an ongoing trend. Let's look at the technical situation. In the monthly chart (Figure 1), prices moved from the 15 level in 1995 to a high of 47.72 in October 2000. An impressive correction brought prices down to a low at 29.75 in July 2002. Since then, Exxon doubled market capitalization, reaching a high of 64.37 in March 2005, with an impressive peak in volume. As you can see, the ADX value reached a record high at 67 back in 1997. Nowadays, the ADX is at a respectable 44.2 level and still rising, indicating a strong trend. The Bollinger Bands are rising and parallel, but prices did not manage to tag the bands after the March 2005 high. |

|
| Figure 1: The monthly chart of Exxon displays the strong uptrend of the past years. |
| Graphic provided by: TradeStation. |
| |
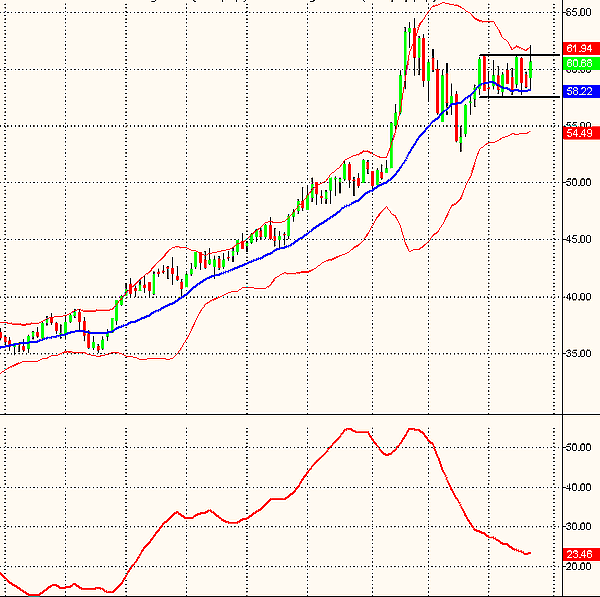
| At the weekly level (Figure 2), prices in the past three years moved upward in a parabolic movement, hitting a peak last March. After this relative high, the Bollinger Bands converged, indicating at least a temporary consolidation of prices. The technical situation was confirmed by the ADX that moved from a value of 55 to the current value of 23. In fact, since mid-June prices started a congestion, still ongoing after 12 bars. From here, volatility is about to rise in a new trend. |

|
| Figure 2: The weekly chart displays the 12-bar congestion. |
| Graphic provided by: TradeStation. |
| |
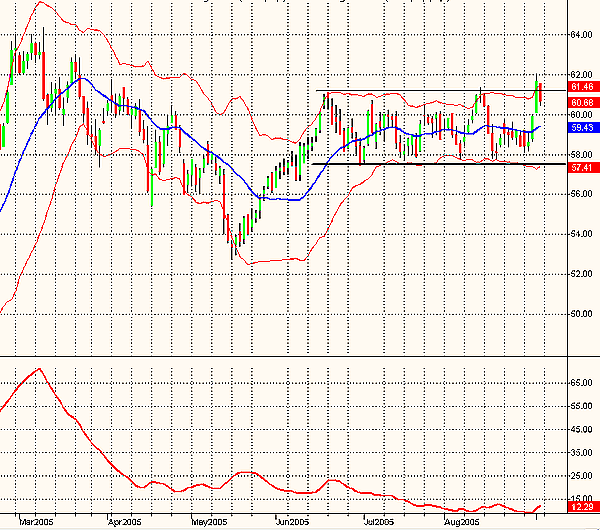
| In the daily chart (Figure 3), you can see the trading range that started last June, characterized by extremely low values of the ADX, which decreased from the value of 20 to the current 12. In this market condition, you can expect a new trend emerging from the prolonged congestion. During the last two trading sessions, volume more than doubled from its average value with a tentative breakout to the upside. The September 1st bar was a setup for the turtle soup plus (see my May 2nd Traders Advantage article). The rules for sells: -The previous 20-day high has to be at least three days earlier. The close for the day must be at or above the previous 20-day high. -The entry sell-stop is placed the next day at the earlier 20-day high. -A retest of the x-day high does not follow a close above it. The September 2nd bar confirmed the setup, reentering the trading range following the negative close of oil on the markets. This could be negative at least in the short term. If you were to switch your trading style to a "breakout mode," it might be possible to enter the market and exploit the high-volatility environment to come. Be aware, however, of the (bull and bear) traps you could find on the way. Stops must be applied with discipline in this environment. There's a good lesson in the last trading session's false breakout! |

|
| Figure 3: The prolonged trading range on the daily chart and the low values of ADX anticipate a high-volatility environment. |
| Graphic provided by: TradeStation. |
| |
Author of the book "Trading the US Markets - A Comprehensive Guide to US Markets for International Traders and Investors" - Harriman House (July 2008)
| Address: | VIA ROBERTO AGO 26 POSTAL CODE 00166 |
| Rome, ITALY | |
| Phone # for sales: | +393357540708 |
| E-mail address: | pezzutti.paolo@tiscali.it |
Click here for more information about our publications!
Comments
Date: 09/08/05Rank: 4Comment:
Date: 09/13/05Rank: 4Comment:

Request Information From Our Sponsors
- VectorVest, Inc.
- Executive Premier Workshop
- One-Day Options Course
- OptionsPro
- Retirement Income Workshop
- Sure-Fire Trading Systems (VectorVest, Inc.)
- Trading as a Business Workshop
- VectorVest 7 EOD
- VectorVest 7 RealTime/IntraDay
- VectorVest AutoTester
- VectorVest Educational Services
- VectorVest OnLine
- VectorVest Options Analyzer
- VectorVest ProGraphics v6.0
- VectorVest ProTrader 7
- VectorVest RealTime Derby Tool
- VectorVest Simulator
- VectorVest Variator
- VectorVest Watchdog
- StockCharts.com, Inc.
- Candle Patterns
- Candlestick Charting Explained
- Intermarket Technical Analysis
- John Murphy on Chart Analysis
- John Murphy's Chart Pattern Recognition
- John Murphy's Market Message
- MurphyExplainsMarketAnalysis-Intermarket Analysis
- MurphyExplainsMarketAnalysis-Visual Analysis
- StockCharts.com
- Technical Analysis of the Financial Markets
- The Visual Investor
