HOT TOPICS LIST
- MACD
- Fibonacci
- RSI
- Gann
- ADXR
- Stochastics
- Volume
- Triangles
- Futures
- Cycles
- Volatility
- ZIGZAG
- MESA
- Retracement
- Aroon
INDICATORS LIST
LIST OF TOPICS
PRINT THIS ARTICLE
by Koos van der Merwe
... And the price of oil soars, with no end in sight.
Position: Hold
Koos van der Merwe
Has been a technical analyst since 1969, and has worked as a futures and options trader with First Financial Futures in Johannesburg, South Africa.
PRINT THIS ARTICLE
ELLIOTT WAVE
Paramount Resources Ltd.
09/02/05 08:35:03 AMby Koos van der Merwe
... And the price of oil soars, with no end in sight.
Position: Hold
| Paramount Resources Ltd. is a Canadian resource company engaged in the exploration for and the development and production of petroleum and natural gas, principally in western Canada. Second-quarter 2005 production volume averaged 2,840 Boe/d, made up of 13 MMcf/d of natural gas and 694 Bbl/d of oil and natural gas liquids (NGLs), up 36% from first-quarter production of 2,090 Boe/d, made up of 11 MMcf/d of natural gas and 284 Bbl/d of oil and NGLs. Compared to the second quarter of 2004, production is up 297% from average production volumes... |
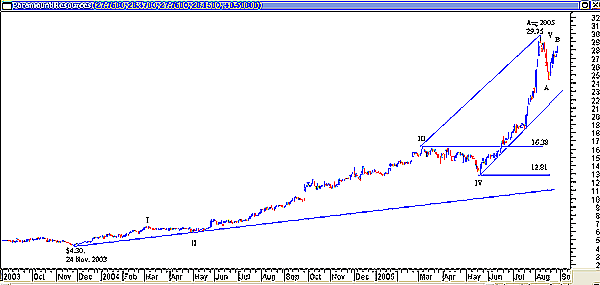
| Alberta, Canada, is where the action is, and US Vice President Dick Cheney is there for an official visit and probably some bargaining. Estimates are that there is more oil in the oil sands of Alberta than in Saudi Arabia. Until now, it has not been profitable to extract the oil, but with the present high prices, shareholders of companies such as Paramount have done exceptionally well. Figure 1 shows how the share price has risen from a low of $4.30 in November 2003 to a high of $29.75 on August 9, 2005, a return of 592%. |

|
| Figure 1: Long-term chart of Paramount |
| Graphic provided by: MetaStock. |
| |
| The chart shows a perfect Elliott wave count, with the fifth wave topping on August 9. Since then, an A-wave down has been completed and the price is now moving upward into a B-wave. B-waves are extremely volatile and their tops are uncertain. They are followed by a C-wave, which means that the price should fall to somewhere between $12.81 and $16.38, the fourth wave of lesser degree. |
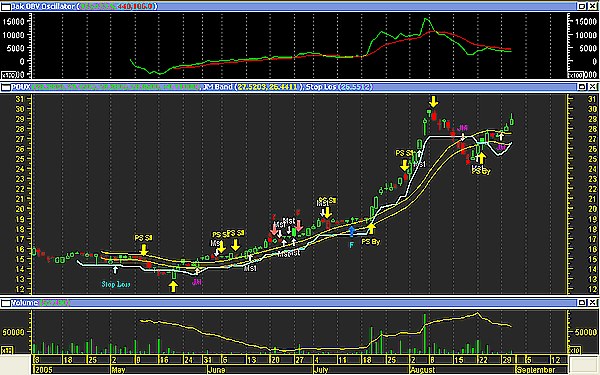
| The question before us is whether the B-wave is complete or close to be completed. With Hurricane Katrina having put a large number of oil wells out of action in the Gulf of Mexico, oil prices reached new highs, but when President Bush announced that US strategic oil reserves would be used to meet the oil shortfall, prices of oil stopped rising and started drifting sideways. The gamble, of course, is if there will be another hurricane before the season ends. Last year, Florida had two hurricanes within weeks, so the possibility does exist. This could mean that the B-wave could continue rising, testing the high of $29.75, and could even exceed it if a second hurricane happens. To answer this question, I turned to technicals on a shorter-term daily chart, and examined my various indicators. |

|
| Figure 2: Daily chart showing buy-sell indicators |
| Graphic provided by: MetaStock. |
| |
| Figure 2 shows the following starting from the left: JM internal band (JM purple arrow). A 15-period moving average offset by 2% and -2%. The indicator is a long-term indicator and is currently showing a buy signal because the price has risen above the upper band. F (Blue - buy; Red - sell). This is the Fisher transform indicator. It is covered by the: PS St indicator (yellow). This is a stochastic relative strength index (RSI) with a nine-period parameter. MST is a moving average stochastic--that is, where the stochastic crosses a five-period moving average. I propose using this indicator as an early warning signal. The upper inner chart is an OBV oscillator with a moving average. This indicator gives me an idea of the strength of the volume. It is possible that the trend is still down because the indicator (green line) is below the moving average (red line). The lower inner chart is the daily volume with a 23-period simple moving average. Finally, I have added a stop-loss to the chart (thick blue line). The formula is the highest high reached over the last 10 periods less 8%. To conclude, the chart is suggesting a B-wave completion, but rather than sell on a target price, I will wait to be taken out by one of my indicators, with the stop-loss as the level of last resort. Note: Should any reader require the MetaStock formula for any of the indicators, they are welcome to email me. |
Has been a technical analyst since 1969, and has worked as a futures and options trader with First Financial Futures in Johannesburg, South Africa.
| Address: | 3256 West 24th Ave |
| Vancouver, BC | |
| Phone # for sales: | 6042634214 |
| E-mail address: | petroosp@gmail.com |
Click here for more information about our publications!
Comments
Date: 09/05/05Rank: 2Comment:

Request Information From Our Sponsors
- StockCharts.com, Inc.
- Candle Patterns
- Candlestick Charting Explained
- Intermarket Technical Analysis
- John Murphy on Chart Analysis
- John Murphy's Chart Pattern Recognition
- John Murphy's Market Message
- MurphyExplainsMarketAnalysis-Intermarket Analysis
- MurphyExplainsMarketAnalysis-Visual Analysis
- StockCharts.com
- Technical Analysis of the Financial Markets
- The Visual Investor
- VectorVest, Inc.
- Executive Premier Workshop
- One-Day Options Course
- OptionsPro
- Retirement Income Workshop
- Sure-Fire Trading Systems (VectorVest, Inc.)
- Trading as a Business Workshop
- VectorVest 7 EOD
- VectorVest 7 RealTime/IntraDay
- VectorVest AutoTester
- VectorVest Educational Services
- VectorVest OnLine
- VectorVest Options Analyzer
- VectorVest ProGraphics v6.0
- VectorVest ProTrader 7
- VectorVest RealTime Derby Tool
- VectorVest Simulator
- VectorVest Variator
- VectorVest Watchdog
