HOT TOPICS LIST
- MACD
- Fibonacci
- RSI
- Gann
- ADXR
- Stochastics
- Volume
- Triangles
- Futures
- Cycles
- Volatility
- ZIGZAG
- MESA
- Retracement
- Aroon
INDICATORS LIST
LIST OF TOPICS
PRINT THIS ARTICLE
by David Penn
Housing bubble or no, an oversold market with plenty of short interest is one that is likely to bounce.
Position: N/A
David Penn
Technical Writer for Technical Analysis of STOCKS & COMMODITIES magazine, Working-Money.com, and Traders.com Advantage.
PRINT THIS ARTICLE
RETRACEMENT
The Bid In The Bubble
08/31/05 03:21:30 PMby David Penn
Housing bubble or no, an oversold market with plenty of short interest is one that is likely to bounce.
Position: N/A
| Remember Marvin the Martian? The interplanetary adversary of popular cartoon character Bugs Bunny whose plans to destroy the Earth (which was blocking his view of Venus, if I recall correctly) were unparalleled in their futility? "Where is the boom?" Marvin would shout incredulously, as yet another doomsday plan* was foiled by the ever-resourceful rabbit. "Where is the Earth-shattering ka-boom?" |
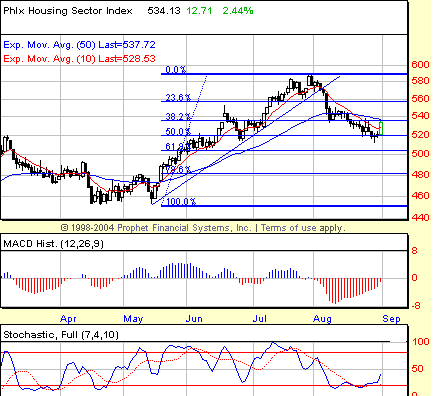
| Those looking to wreak similar havoc on housing stocks may find themselves asking Marvin's classic question as well. After topping out July, the Philadelphia Housing Sector Index, or $HGX, seems to have found at least temporary support at a level halfway between where its rally began in May and where housing bears hope it ended in July. |

|
| Figure 1: The August correction in housing stocks took about 50% of the rally that began in the spring. |
| Graphic provided by: Prophet Financial, Inc. |
| |
| When traders and technicians think about Fibonacci retracements, the tendency is to think of the more exotic Fibonacci levels such as 61.8% and 38.2%. But one of the most frequently visited retracement levels doesn't even require awareness of "Fib ratios" at all. That retracement level is simply 50%. It is also exactly where the correction in housing stocks, as measured by the $HGX, appears to have established a short- to intermediate-term bottom. This bottom is suggested by a number of factors. The Japanese candlestick patterns late in August show a predominance of lower shadows as opposed to upper shadows. This means that during those days, buyers of housing stocks were willing to bid shares higher after intraday declines. Whether because of bargain hunting or short-covering, demand for housing stocks in late August, session after session, was enough to keep prices from closing at or near the low of the day. |
| There is also an intramonth positive stochastic divergence in August that suggested a bounce at a minimum. To be accurate, it was actually a running or multiple positive stochastic divergence as a trio of higher lows in the 7,10 stochastic (August 10, 23, and 30) were matched by a trio of lower lows in the price action of the housing sector index. Whether a trader attempted to buy the bottom after the first positive divergence (August 10 and 23) or the more recent one on August 30, it was clear that housing stocks were done going down for now. Bubble-shattering ka-boom averted--at least for now, puny Earth rabbit! |
| *Sorry, but I can't resist a bit of Dennis Miller-esque memory hole spelunking. Does anybody remember the name of Marvin the Martian's Earth-destroying weapon of mass destruction? How about the "Illudium Q-36 Explosive Space Modulator"! |
Technical Writer for Technical Analysis of STOCKS & COMMODITIES magazine, Working-Money.com, and Traders.com Advantage.
| Title: | Technical Writer |
| Company: | Technical Analysis, Inc. |
| Address: | 4757 California Avenue SW |
| Seattle, WA 98116 | |
| Phone # for sales: | 206 938 0570 |
| Fax: | 206 938 1307 |
| Website: | www.Traders.com |
| E-mail address: | DPenn@traders.com |
Traders' Resource Links | |
| Charting the Stock Market: The Wyckoff Method -- Books | |
| Working-Money.com -- Online Trading Services | |
| Traders.com Advantage -- Online Trading Services | |
| Technical Analysis of Stocks & Commodities -- Publications and Newsletters | |
| Working Money, at Working-Money.com -- Publications and Newsletters | |
| Traders.com Advantage -- Publications and Newsletters | |
| Professional Traders Starter Kit -- Software | |
Click here for more information about our publications!
Comments
Date: 08/31/05Rank: 3Comment:
Date: 09/06/05Rank: 5Comment: Good article. Did you attend the Science Fiction Fantasy Convention this past weekend? The Seattle members of that organization will probably know the answers to your question.

Request Information From Our Sponsors
- StockCharts.com, Inc.
- Candle Patterns
- Candlestick Charting Explained
- Intermarket Technical Analysis
- John Murphy on Chart Analysis
- John Murphy's Chart Pattern Recognition
- John Murphy's Market Message
- MurphyExplainsMarketAnalysis-Intermarket Analysis
- MurphyExplainsMarketAnalysis-Visual Analysis
- StockCharts.com
- Technical Analysis of the Financial Markets
- The Visual Investor
- VectorVest, Inc.
- Executive Premier Workshop
- One-Day Options Course
- OptionsPro
- Retirement Income Workshop
- Sure-Fire Trading Systems (VectorVest, Inc.)
- Trading as a Business Workshop
- VectorVest 7 EOD
- VectorVest 7 RealTime/IntraDay
- VectorVest AutoTester
- VectorVest Educational Services
- VectorVest OnLine
- VectorVest Options Analyzer
- VectorVest ProGraphics v6.0
- VectorVest ProTrader 7
- VectorVest RealTime Derby Tool
- VectorVest Simulator
- VectorVest Variator
- VectorVest Watchdog
