HOT TOPICS LIST
- MACD
- Fibonacci
- RSI
- Gann
- ADXR
- Stochastics
- Volume
- Triangles
- Futures
- Cycles
- Volatility
- ZIGZAG
- MESA
- Retracement
- Aroon
INDICATORS LIST
LIST OF TOPICS
PRINT THIS ARTICLE
by Arthur Hill
After moving from 40 to 55, Procter & Gamble met resistance and formed a large consolidation for the past year. The subsequent breakout will dictate the next move.
Position: Hold
Arthur Hill
Arthur Hill is currently editor of TDTrader.com, a website specializing in trading strategies, sector/industry specific breadth stats and overall technical analysis. He passed the Society of Technical Analysts (STA London) diploma exam with distinction is a Certified Financial Technician (CFTe). Prior to TD Trader, he was the Chief Technical Analyst for Stockcharts.com and the main contributor to the ChartSchool.
PRINT THIS ARTICLE
TRIANGLES
Procter & Gamble's Massive Triangle
08/31/05 09:18:56 AMby Arthur Hill
After moving from 40 to 55, Procter & Gamble met resistance and formed a large consolidation for the past year. The subsequent breakout will dictate the next move.
Position: Hold
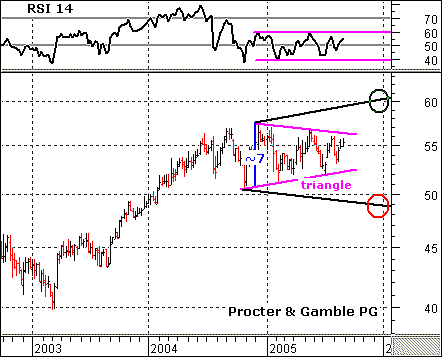
| On the price chart, Procter & Gamble (PG) has traded on either side of 55 at least 13 times since June 2004 (Figure 1). The gyrations widened in late 2004 and contracted in 2005. The pattern since January 2005 looks like a large triangle. If combined with 2004, the pattern could be considered a diamond. Triangles are neutral patterns that are dependent on a breakout for a signal. A move above the upper trendline would be bullish and a move below the lower trendline would be bearish. |

|
| Figure 1: Procter & Gamble has traded around 55 since June 2004. |
| Graphic provided by: MetaStock. |
| Graphic provided by: Reuters Data. |
| |
| There are two methods to project a target. First, analysts can add or subtract the width of the triangle to the breakpoint. The width is around 7 points, and this projects an advance to 62 or a decline to 45. The second method is to draw parallel trendlines above or below the triangle. These were drawn in black on the chart. The lower trendline extends to 48-49 by the end of the year and the upper trendline extends to 60-61. Based on these projections, I would expect a move into the low 60s on an upside breakout and a move into the upper 40s on a downside break. |
| The relative strength index (RSI) confirms the consolidation and can be used to confirm a signal. While PG has traded on either side of 55 this year, RSI has traded on either side of 50. The RSI range is 40 to 61, and I would watch these levels for a momentum break. A move above 61 would turn momentum bullish and a move below 40 would turn momentum bearish. |
Arthur Hill is currently editor of TDTrader.com, a website specializing in trading strategies, sector/industry specific breadth stats and overall technical analysis. He passed the Society of Technical Analysts (STA London) diploma exam with distinction is a Certified Financial Technician (CFTe). Prior to TD Trader, he was the Chief Technical Analyst for Stockcharts.com and the main contributor to the ChartSchool.
| Title: | Editor |
| Company: | TDTrader.com |
| Address: | Willem Geetsstraat 17 |
| Mechelen, B2800 | |
| Phone # for sales: | 3215345465 |
| Website: | www.tdtrader.com |
| E-mail address: | arthurh@tdtrader.com |
Traders' Resource Links | |
| TDTrader.com has not added any product or service information to TRADERS' RESOURCE. | |
Click here for more information about our publications!
Comments
Date: 08/31/05Rank: 3Comment:

Request Information From Our Sponsors
- StockCharts.com, Inc.
- Candle Patterns
- Candlestick Charting Explained
- Intermarket Technical Analysis
- John Murphy on Chart Analysis
- John Murphy's Chart Pattern Recognition
- John Murphy's Market Message
- MurphyExplainsMarketAnalysis-Intermarket Analysis
- MurphyExplainsMarketAnalysis-Visual Analysis
- StockCharts.com
- Technical Analysis of the Financial Markets
- The Visual Investor
- VectorVest, Inc.
- Executive Premier Workshop
- One-Day Options Course
- OptionsPro
- Retirement Income Workshop
- Sure-Fire Trading Systems (VectorVest, Inc.)
- Trading as a Business Workshop
- VectorVest 7 EOD
- VectorVest 7 RealTime/IntraDay
- VectorVest AutoTester
- VectorVest Educational Services
- VectorVest OnLine
- VectorVest Options Analyzer
- VectorVest ProGraphics v6.0
- VectorVest ProTrader 7
- VectorVest RealTime Derby Tool
- VectorVest Simulator
- VectorVest Variator
- VectorVest Watchdog
