HOT TOPICS LIST
- MACD
- Fibonacci
- RSI
- Gann
- ADXR
- Stochastics
- Volume
- Triangles
- Futures
- Cycles
- Volatility
- ZIGZAG
- MESA
- Retracement
- Aroon
INDICATORS LIST
LIST OF TOPICS
PRINT THIS ARTICLE
by Gary Grosschadl
When the daily chart shows a downleg, it's prudent to consult a longer-term chart (say a weekly one) for further insight.
Position: Sell
Gary Grosschadl
Independent Canadian equities trader and technical analyst based in Peterborough
Ontario, Canada.
PRINT THIS ARTICLE
WEDGE FORMATIONS
S&P 500 In A Bearish Pattern
08/31/05 09:10:38 AMby Gary Grosschadl
When the daily chart shows a downleg, it's prudent to consult a longer-term chart (say a weekly one) for further insight.
Position: Sell
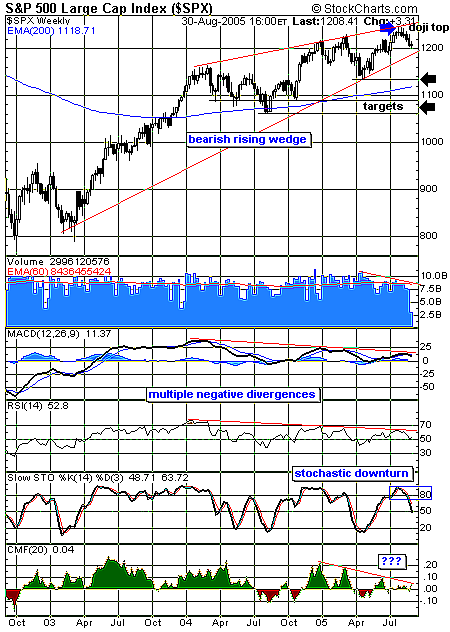
| This weekly chart of the Standard & Poor's 500 shows a large bearish rising wedge (Figure 1). As this pattern tightens, it becomes weaker -- weaker because negative divergences point to questionable strength. |
| Note the candlestick pattern at the top of the pattern. It's a combination of a doji (tell-tale cross) and a tweezer top (equal highs via upper shadows). Either of these patterns after a strong rise hints at a coming correction in the form of bullish hesitation, which often marks an early trend shift. |

|
| Figure 1: The strong rising trend has built-in weaknesses in this weekly view. |
| Graphic provided by: StockCharts.com. |
| |
| Most of the lower indicators show negative divergences to price action, starting with the volume pattern as of late. Particularily noticeable is the drying up of bullish buying power as reflected in the Chaikin money flow indicator, begging the question: Where have the bulls gone? |
| Several feasible downside targets are shown relating to previous support points; note the proximity to the 200-period moving average, which is often an important area of support/resistance. "Beware the doji at the top" seems to be a mantra I remember. |
Independent Canadian equities trader and technical analyst based in Peterborough
Ontario, Canada.
| Website: | www.whatsonsale.ca/financial.html |
| E-mail address: | gwg7@sympatico.ca |
Click here for more information about our publications!
Comments
Date: 09/03/05Rank: 4Comment:

Request Information From Our Sponsors
- StockCharts.com, Inc.
- Candle Patterns
- Candlestick Charting Explained
- Intermarket Technical Analysis
- John Murphy on Chart Analysis
- John Murphy's Chart Pattern Recognition
- John Murphy's Market Message
- MurphyExplainsMarketAnalysis-Intermarket Analysis
- MurphyExplainsMarketAnalysis-Visual Analysis
- StockCharts.com
- Technical Analysis of the Financial Markets
- The Visual Investor
- VectorVest, Inc.
- Executive Premier Workshop
- One-Day Options Course
- OptionsPro
- Retirement Income Workshop
- Sure-Fire Trading Systems (VectorVest, Inc.)
- Trading as a Business Workshop
- VectorVest 7 EOD
- VectorVest 7 RealTime/IntraDay
- VectorVest AutoTester
- VectorVest Educational Services
- VectorVest OnLine
- VectorVest Options Analyzer
- VectorVest ProGraphics v6.0
- VectorVest ProTrader 7
- VectorVest RealTime Derby Tool
- VectorVest Simulator
- VectorVest Variator
- VectorVest Watchdog
