HOT TOPICS LIST
- MACD
- Fibonacci
- RSI
- Gann
- ADXR
- Stochastics
- Volume
- Triangles
- Futures
- Cycles
- Volatility
- ZIGZAG
- MESA
- Retracement
- Aroon
INDICATORS LIST
LIST OF TOPICS
PRINT THIS ARTICLE
by David Penn
An Adam & Adam double top over the summer leads to declines near season's end.
Position: N/A
David Penn
Technical Writer for Technical Analysis of STOCKS & COMMODITIES magazine, Working-Money.com, and Traders.com Advantage.
PRINT THIS ARTICLE
DOUBLE TOPS
Cree's Double Top
08/31/05 09:01:49 AMby David Penn
An Adam & Adam double top over the summer leads to declines near season's end.
Position: N/A
In Encyclopedia Of Chart Patterns, his classic text on chart patterns, author and trader Thomas Bulkowski notes this of double tops:
|
| Double tops are among the more favored chart patterns by many traders because of their simplicity. Two peaks rising to roughly the same level, separated by a few weeks or a few months ... that pretty much takes care of the fundamentals of spotting double top formations in price charts. All of the variations that Bulkowski has discovered (particularly the Adam & Eve variations, which appear in the second edition of his Encyclopedia Of Chart Patterns) still work from the conception of double tops. |

|
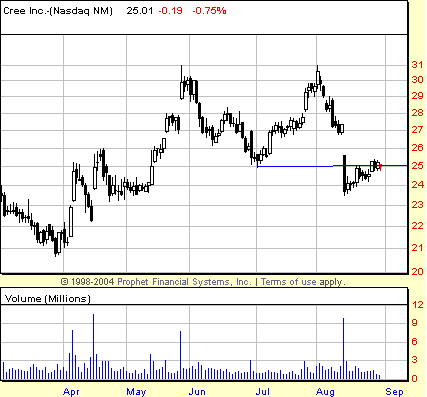
| Figure 1: This summer-long double top in CREE suggests a minimum downside to 22 by fall. |
| Graphic provided by: Prophet Financial, Inc. |
| |
| If I had a preference when it comes to double tops, it would be that the second top is somewhat higher than the first. This is because that would open the door for other technical signals--such as the 2B test of top and the negative stochastic divergence--that could confirm the bearishness of the double top pattern. In the example of Cree in Figure 1, however, there are no such complimentary signals. The peak in late May is only a cent or two higher than the peak in early August. That rules out both the possibility of a 2B test of top as well as the applicability of the negative divergence. But those are preferences, not requirements. All that is required of a double top, as I mentioned at the outset, are the properly separated peaks, and the significantly deep trough between them. This has been very much the case for CREE over the past several months, as a peak in late May was separated from a similarly sized peak in earliest August by a just-over-two-month trough that saw prices fall from a peak level near 31 to a intrapeak trough low of 25. |
Bulkowski cautions traders to wait for prices to break through the confirmation line before initiating positions. That confirmation line is a horizontal line drawn from the low point of the intrapeak trough. As Figure 1 shows, CREE smashed through that confirmation line in mid-August on truly "shock and awe" volume. However, shares bounced immediately after the plunge. This leads us to Bulkowski's other key point about double tops:
|
| How relevant is this observation to the fate of CREE and its mid-August breakout? With a breakout level at 25, CREE fell to a closing low of 23.70. That was about 5.2% beyond the breakout level. So on a technical basis--including the caveat that the low of the day was at 23.54, or 5.8% below the breakout level--CREE avoids the 5% failure. This is true even as prices have spent the second half of August inching back up to the breakout level. Combined with the expansive volume on the breakout, these are powerful technicals that suggest that CREE is likely to move lower before moving significantly higher. Potential resistance to any further upside lies in the top and bottom of the "gap zone," 26.75 and 25.60. |
Technical Writer for Technical Analysis of STOCKS & COMMODITIES magazine, Working-Money.com, and Traders.com Advantage.
| Title: | Technical Writer |
| Company: | Technical Analysis, Inc. |
| Address: | 4757 California Avenue SW |
| Seattle, WA 98116 | |
| Phone # for sales: | 206 938 0570 |
| Fax: | 206 938 1307 |
| Website: | www.Traders.com |
| E-mail address: | DPenn@traders.com |
Traders' Resource Links | |
| Charting the Stock Market: The Wyckoff Method -- Books | |
| Working-Money.com -- Online Trading Services | |
| Traders.com Advantage -- Online Trading Services | |
| Technical Analysis of Stocks & Commodities -- Publications and Newsletters | |
| Working Money, at Working-Money.com -- Publications and Newsletters | |
| Traders.com Advantage -- Publications and Newsletters | |
| Professional Traders Starter Kit -- Software | |
Click here for more information about our publications!
Comments
Date: 08/31/05Rank: 4Comment:

Request Information From Our Sponsors
- StockCharts.com, Inc.
- Candle Patterns
- Candlestick Charting Explained
- Intermarket Technical Analysis
- John Murphy on Chart Analysis
- John Murphy's Chart Pattern Recognition
- John Murphy's Market Message
- MurphyExplainsMarketAnalysis-Intermarket Analysis
- MurphyExplainsMarketAnalysis-Visual Analysis
- StockCharts.com
- Technical Analysis of the Financial Markets
- The Visual Investor
- VectorVest, Inc.
- Executive Premier Workshop
- One-Day Options Course
- OptionsPro
- Retirement Income Workshop
- Sure-Fire Trading Systems (VectorVest, Inc.)
- Trading as a Business Workshop
- VectorVest 7 EOD
- VectorVest 7 RealTime/IntraDay
- VectorVest AutoTester
- VectorVest Educational Services
- VectorVest OnLine
- VectorVest Options Analyzer
- VectorVest ProGraphics v6.0
- VectorVest ProTrader 7
- VectorVest RealTime Derby Tool
- VectorVest Simulator
- VectorVest Variator
- VectorVest Watchdog
