HOT TOPICS LIST
- MACD
- Fibonacci
- RSI
- Gann
- ADXR
- Stochastics
- Volume
- Triangles
- Futures
- Cycles
- Volatility
- ZIGZAG
- MESA
- Retracement
- Aroon
INDICATORS LIST
LIST OF TOPICS
PRINT THIS ARTICLE
by Gary Grosschadl
This volatile penny stock has formed a large trading range and is currently coming off an important low.
Position: Buy
Gary Grosschadl
Independent Canadian equities trader and technical analyst based in Peterborough
Ontario, Canada.
PRINT THIS ARTICLE
CHART ANALYSIS
Loudeye Technologies Looking Like A Noise Maker
08/30/05 07:50:27 AMby Gary Grosschadl
This volatile penny stock has formed a large trading range and is currently coming off an important low.
Position: Buy
| Because penny stocks tend to be fraught with added danger and higher risk, most traders get burned by them. One way to play them is to pick them when they are relatively cheap and then sell them into a buying frenzy when others seem to be screaming, "This baby is going to the moon!" For the few penny stocks that do, there are just as many, if not much, much more that just become craters in the crash and burn landscape. Those investors who profit from them wisely do not overstay the party. |
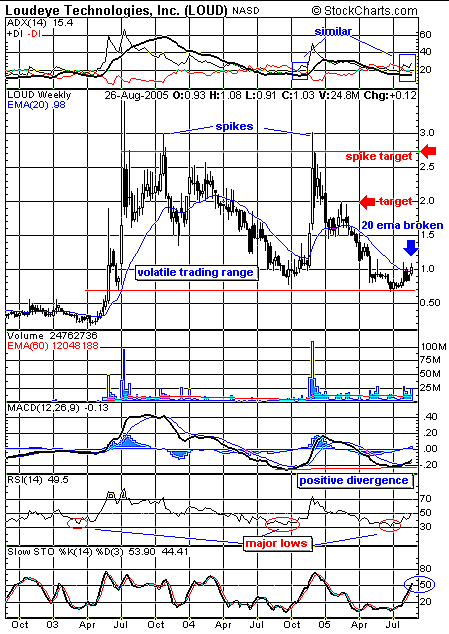
| Having said all that, this one looks like an interesting bet, and yes, we are talking a gamble here, so I'm not betting the farm. Perhaps a little play money, though. This weekly chart (Figure 1) suggests a large trading range and hints at a move off a low with the possibility of another spike upward. |

|
| Figure 1: LOUD. Eyeing a risky play on this weekly chart. |
| Graphic provided by: StockCharts.com. |
| |
| Several indicators seem to agree that an important low has been put in. First, note the price move above the 20-period exponential moving average (EMA). The previous large spike upward (late last year) was preceded by a close above this often-important overhead moving average. Last week's close on encouraging volume has the same signature. And speaking of the same signature, look at the top-most graph of Figure 1 showing the three components of the directional movement indicator. Note the very similar circumstance. The DIs have recently crossed, so that bullish power (+DI) is above bearish power (-DI). All that remains now is for the average directional index (ADX) to break above -DI. The moving average convergence/divergence (MACD) indicator shows two bullish signs via a bullish cross and a positive divergence to price action. The relative strength index (RSI) shows a move off an important low in the 30 realm. Finally, the stochastic oscillator shows a move beginning just above the often telling 50 area. |
| Two upside targets are indicated. The higher one is the "to the moon Alice" goal of the spike target of the $2.70 region. A more prudent goal would be the target of $2, representing a zone of previous support and resistance. I have no doubt some early bird gamblers will use this zone to unload some shares to the "to the moon" crowd. For those with a thirst for trading danger, the high-risk/high-reward crowd, this play could be entertaining. |
Independent Canadian equities trader and technical analyst based in Peterborough
Ontario, Canada.
| Website: | www.whatsonsale.ca/financial.html |
| E-mail address: | gwg7@sympatico.ca |
Click here for more information about our publications!
Comments
Date: 08/30/05Rank: 5Comment:

Request Information From Our Sponsors
- StockCharts.com, Inc.
- Candle Patterns
- Candlestick Charting Explained
- Intermarket Technical Analysis
- John Murphy on Chart Analysis
- John Murphy's Chart Pattern Recognition
- John Murphy's Market Message
- MurphyExplainsMarketAnalysis-Intermarket Analysis
- MurphyExplainsMarketAnalysis-Visual Analysis
- StockCharts.com
- Technical Analysis of the Financial Markets
- The Visual Investor
- VectorVest, Inc.
- Executive Premier Workshop
- One-Day Options Course
- OptionsPro
- Retirement Income Workshop
- Sure-Fire Trading Systems (VectorVest, Inc.)
- Trading as a Business Workshop
- VectorVest 7 EOD
- VectorVest 7 RealTime/IntraDay
- VectorVest AutoTester
- VectorVest Educational Services
- VectorVest OnLine
- VectorVest Options Analyzer
- VectorVest ProGraphics v6.0
- VectorVest ProTrader 7
- VectorVest RealTime Derby Tool
- VectorVest Simulator
- VectorVest Variator
- VectorVest Watchdog
