HOT TOPICS LIST
- MACD
- Fibonacci
- RSI
- Gann
- ADXR
- Stochastics
- Volume
- Triangles
- Futures
- Cycles
- Volatility
- ZIGZAG
- MESA
- Retracement
- Aroon
INDICATORS LIST
LIST OF TOPICS
PRINT THIS ARTICLE
by David Penn
Does the Katrina spike spell the end of crude's crazy rally?
Position: N/A
David Penn
Technical Writer for Technical Analysis of STOCKS & COMMODITIES magazine, Working-Money.com, and Traders.com Advantage.
PRINT THIS ARTICLE
STOCHASTICS
Crude's Cracked Wall Of Worry
08/30/05 09:29:52 AMby David Penn
Does the Katrina spike spell the end of crude's crazy rally?
Position: N/A
| They say a watched pot never boils. But if you bring up the heat hard enough, it seems like you can get just about any kettle piping--at least for a while. |
| That's my initial reaction to the buying in crude oil futures leading up to the landfall of Hurricane Katrina, a storm that began as a category 5 before recently downgraded to a category 3. Overnight, before the storm brushed past New Orleans, crude oil futures soared above $70 a barrel and stock futures dipped sharply as it appeared that Katrina would be every bit the perfect storm the cable news commentators were making it out to be. |

|
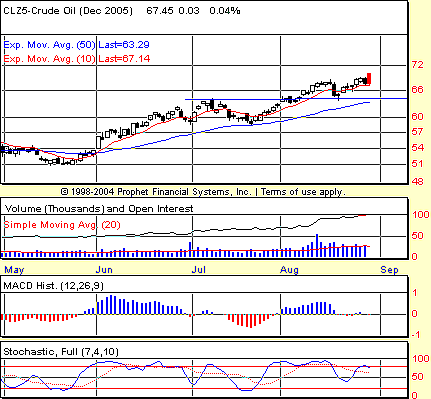
| Figure 1: Another negative stochastic divergence ... another chance for a correction in crude. |
| Graphic provided by: Prophet Financial, Inc. |
| |
| So is the chalk play a chump play? With commentators such as Don Luskin (trendmacro.com) insisting that lower crude oil prices were right around the corner, a phenomenon like Hurricane Katrina, which damages a sizable portion of the D&E (drilling and exploration) infrastructure in the Gulf of Mexico, seemed tailor-made for those who need to continue to explain why crude oil's lower-priced future is not yet a lower-priced "now." (See Figure 1.) I've argued recently that there is a case to be made for much higher crude oil prices (see my "A King-Sized Wave Count For Crude," August 9, 2005; Traders.com Advantage). Put simply: crude oil was in an extended, largely sideways bear market for 20 years during the 1980s and 1990s--a bear market that looks a lot like the 1962-82 secular bear market in stocks, only inverted. If that is the case, then the secular bull market in crude oil is not even four years old yet. For perspective, think of where other markets were just four years into their secular trends. On the bullish side, consider the stock market in 1938 or 1978. On the bearish side, consider stocks in 1966. In the first two instances, stocks had more upside over the next 10 to 20 years than anyone could have imagined at the time. And that upside wasn't without its pain, either--in the form of cyclical bear markets. To get to 1962 from 1938, you had to go through the bear markets of the 1937-42 period. To get to 2000 from 1978, you had to go through the brutal recession of 1982 and the malaise of the late 1980s and early 1990s. I say all that to say this: Even in a secular bull market--such as the one I suspect crude oil may have embarked upon--there are corrections and cyclical bear markets that serve as episodes of accumulation for smart and savvy investors and speculators. In bull markets in stocks, these corrections are met with, at best, annoyance and, at worst, pure panic as investors begin to fear that the party has finally ended. In commodity markets, however, the psychology is reversed. As Robert Prechter and A.J. Frost noted years ago in their book, Elliott Wave Principle, greed may be the governing emotion at financial asset peaks, but fear reigns during bull markets in commodities. Most often, that fear is of a shortage by virtue of natural (that is, hurricane) or human (that is, economic cartel)-initiated shortage. Whatever the rationale, it is worth remembering that corrections in commodity prices will tend to be met with positive emotional responses rather than negative ones. This means that every dip in crude oil prices will likely be met with relieved cries that the torment of soaring energy prices has finally ended. As soothing as these words are likely to be emotionally, traders should be vigilant--insisting that the crude oil market, like any other market, prove that it is truly ready to move lower on something more than an intermediate-term basis, before anyone begins heralding the return of 1982-2002 oil price trends. |

|
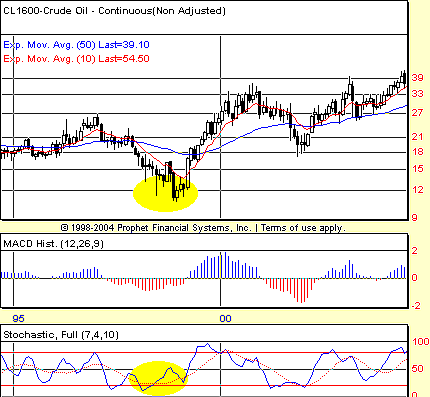
| Figure 2: The secular bull market in crude began with this positive stochastic divergence on the monthly chart. |
| Graphic provided by: Prophet Financial, Inc. |
| |
| Back to the present. The last significant correction in crude oil futures was in the spring of 2005, when--basis continuous futures--crude oil slipped from just over $58 to just under $48, a correction of some 17%. That correction was signaled by a negative stochastic divergence--as well as an arguably negative moving average convergence/divergence (MACD) histogram divergence--not unlike the negative stochastic divergence that is developing in the December crude oil futures contract in late August. Because these divergences can lead to sideways prices as well as sharply lower ones, traders and speculators might want to watch and see if crude slips below 64, which represents a breakout level from early August (as well as representing the July highs). |
| A crude oil correction that finds support at this level might be the most bullish thing to happen to the crude oil market since the monthly positive stochastic divergence back in the spring of 1999 that set the stage for the secular bull market in crude oil we are "enjoying" today (Figure 2). |
Technical Writer for Technical Analysis of STOCKS & COMMODITIES magazine, Working-Money.com, and Traders.com Advantage.
| Title: | Technical Writer |
| Company: | Technical Analysis, Inc. |
| Address: | 4757 California Avenue SW |
| Seattle, WA 98116 | |
| Phone # for sales: | 206 938 0570 |
| Fax: | 206 938 1307 |
| Website: | www.Traders.com |
| E-mail address: | DPenn@traders.com |
Traders' Resource Links | |
| Charting the Stock Market: The Wyckoff Method -- Books | |
| Working-Money.com -- Online Trading Services | |
| Traders.com Advantage -- Online Trading Services | |
| Technical Analysis of Stocks & Commodities -- Publications and Newsletters | |
| Working Money, at Working-Money.com -- Publications and Newsletters | |
| Traders.com Advantage -- Publications and Newsletters | |
| Professional Traders Starter Kit -- Software | |
Click here for more information about our publications!
Comments
Date: 08/30/05Rank: 3Comment:

Request Information From Our Sponsors
- VectorVest, Inc.
- Executive Premier Workshop
- One-Day Options Course
- OptionsPro
- Retirement Income Workshop
- Sure-Fire Trading Systems (VectorVest, Inc.)
- Trading as a Business Workshop
- VectorVest 7 EOD
- VectorVest 7 RealTime/IntraDay
- VectorVest AutoTester
- VectorVest Educational Services
- VectorVest OnLine
- VectorVest Options Analyzer
- VectorVest ProGraphics v6.0
- VectorVest ProTrader 7
- VectorVest RealTime Derby Tool
- VectorVest Simulator
- VectorVest Variator
- VectorVest Watchdog
- StockCharts.com, Inc.
- Candle Patterns
- Candlestick Charting Explained
- Intermarket Technical Analysis
- John Murphy on Chart Analysis
- John Murphy's Chart Pattern Recognition
- John Murphy's Market Message
- MurphyExplainsMarketAnalysis-Intermarket Analysis
- MurphyExplainsMarketAnalysis-Visual Analysis
- StockCharts.com
- Technical Analysis of the Financial Markets
- The Visual Investor
