HOT TOPICS LIST
- MACD
- Fibonacci
- RSI
- Gann
- ADXR
- Stochastics
- Volume
- Triangles
- Futures
- Cycles
- Volatility
- ZIGZAG
- MESA
- Retracement
- Aroon
INDICATORS LIST
LIST OF TOPICS
PRINT THIS ARTICLE
by Koos van der Merwe
Sometimes we are inclined to overlook what charts are telling us because we need to be convinced by complexity. Here is a chart staring us in the face and shouting, "Watch me!"
Position: N/A
Koos van der Merwe
Has been a technical analyst since 1969, and has worked as a futures and options trader with First Financial Futures in Johannesburg, South Africa.
PRINT THIS ARTICLE
ELLIOTT WAVE
Looking At The NASDAQ In A Simple Way
08/24/05 07:52:33 AMby Koos van der Merwe
Sometimes we are inclined to overlook what charts are telling us because we need to be convinced by complexity. Here is a chart staring us in the face and shouting, "Watch me!"
Position: N/A
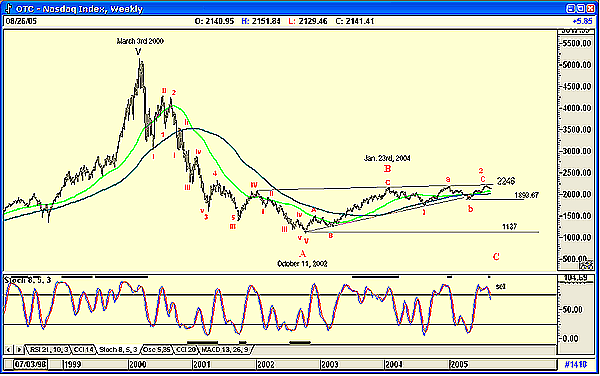
| Figure 1 is a weekly chart of the Nasdaq, showing the end of the fifth wave (V) on March 3, 2002, and the wave count into what I still believe is wave A on October 11, 2002. The index then rose in a B-wave into January 23, 2004, and since then has completed a wave 1 down and a wave 2 up of a major C-wave down. |

|
| Figure 1: NASDAQ Weekly, Elliott Wave Count |
| Graphic provided by: AdvancedGET. |
| |
| This is a significant statement to make. Consider that I am calling for the NASDAQ to collapse by, at the very minimum, 1100 points. This will take it to the level of wave A. Should it break below this level, then we could see the index falling to 324, the level of October 1990, the lowest point that the NASDAQ reached before the start of the bull run into the bubble of 2000. This is scary. Because of this, at the moment I am only prepared to consider a retest of the 1137 level. Here is why: a. At 2246, the index has made a triple top. This is a very strong resistance level, difficult to penetrate. b. At "b," the price penetrated the support line drawn through "V," "B," and "1." This pattern could be a pennant pattern formation, in a downward moving index. This means that the break when made will be down, and this actually occurred, with "b" breaking below the pennant's lower boundary before rising to retest the 2246 level at wave c of wave 2. c. The index is playing with both moving averages, testing them. The light green is the 40-week moving average of the close, and the dark green is the 80-week moving average of the close. A move by the 40-week MA below the 80-week MA will confirm a movement down by the index. Do remember, however, that a moving average in a sideways movement is not that accurate as a trend confirmation, as it is delayed by the length of the average. d. Finally, the stochastic indicator has given a sell signal and is moving down. |

|
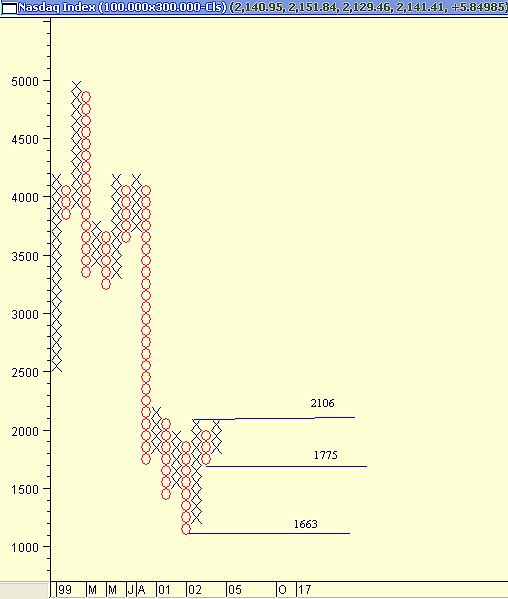
| Figure 2: Point and figure chart of the NASDAQ weekly |
| Graphic provided by: MetaStock. |
| |
| Figure 2, which is a point and figure chart of the weekly price, confirms the triple top formation. The box size is 100 with a three-point reversal of the close. Should the index break above the 2106 level, it will target 3006. This target has been calculated using the horizontal target strategy--that is, 100 x three-point reversal x three columns = 900 + 2106 = 3006. However, should the index break below the 1775 level, it could fall to target 575, using the horizontal target count method. But this time, with four columns and not three, we get 100 x three-point reversal x four columns = 1200. So 1775 - 1200 = 575, close enough to the level of 324 of October 1990 to be scary. |
| To conclude, the NASDAQ is at very critical levels at the moment and should be watched carefully for a major break above or below highlighted pivot points. |
Has been a technical analyst since 1969, and has worked as a futures and options trader with First Financial Futures in Johannesburg, South Africa.
| Address: | 3256 West 24th Ave |
| Vancouver, BC | |
| Phone # for sales: | 6042634214 |
| E-mail address: | petroosp@gmail.com |
Click here for more information about our publications!
Comments
Date: 08/24/05Rank: 3Comment:
Date: 08/25/05Rank: 4Comment:

Request Information From Our Sponsors
- StockCharts.com, Inc.
- Candle Patterns
- Candlestick Charting Explained
- Intermarket Technical Analysis
- John Murphy on Chart Analysis
- John Murphy's Chart Pattern Recognition
- John Murphy's Market Message
- MurphyExplainsMarketAnalysis-Intermarket Analysis
- MurphyExplainsMarketAnalysis-Visual Analysis
- StockCharts.com
- Technical Analysis of the Financial Markets
- The Visual Investor
- VectorVest, Inc.
- Executive Premier Workshop
- One-Day Options Course
- OptionsPro
- Retirement Income Workshop
- Sure-Fire Trading Systems (VectorVest, Inc.)
- Trading as a Business Workshop
- VectorVest 7 EOD
- VectorVest 7 RealTime/IntraDay
- VectorVest AutoTester
- VectorVest Educational Services
- VectorVest OnLine
- VectorVest Options Analyzer
- VectorVest ProGraphics v6.0
- VectorVest ProTrader 7
- VectorVest RealTime Derby Tool
- VectorVest Simulator
- VectorVest Variator
- VectorVest Watchdog
