HOT TOPICS LIST
- MACD
- Fibonacci
- RSI
- Gann
- ADXR
- Stochastics
- Volume
- Triangles
- Futures
- Cycles
- Volatility
- ZIGZAG
- MESA
- Retracement
- Aroon
INDICATORS LIST
LIST OF TOPICS
PRINT THIS ARTICLE
by David Penn
Tracking an intraday retracement with divergences and Fibonacci ratios.
Position: N/A
David Penn
Technical Writer for Technical Analysis of STOCKS & COMMODITIES magazine, Working-Money.com, and Traders.com Advantage.
PRINT THIS ARTICLE
RETRACEMENT
Gaming Retracements
08/23/05 10:19:43 AMby David Penn
Tracking an intraday retracement with divergences and Fibonacci ratios.
Position: N/A
| Traders looking at the Standard & Poor's 500 in the third week of August saw a market that appeared to find real support along its 50-day exponential moving average (EMA). Day after day, sellers attempted to push the market lower, but in spite of the generally bearish mood, support at the 50-day held. |
| That was the view from headquarters. But what did the view from the nearby hills look like? Catching a view of the battle between the bulls and the bears from just beyond the trenches can help a trader get a better understanding of the dynamics of what happens at resistance (or support, conversely). And in this case, that view from the nearby hills rather than from headquarters comes courtesy of the shorter time frame of an hourly chart. |

|
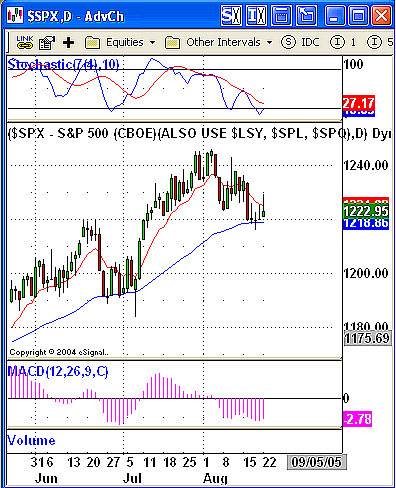
| Figure 1: The 50-day EMA provides support for a softening S&P 500 in mid-August. |
| Graphic provided by: eSignal. |
| |
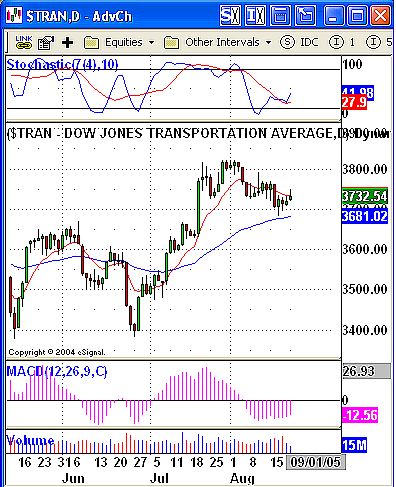
| Here in Figure 1 is a chart of the S&P 500 slipping toward its 50-day EMA in mid-August. While the market is above its 50-day EMA, it is not an especially bullish picture. Is the market simply retracing to its 50-day EMA, or has a significant top occurred--as the negative stochastic divergence may be suggesting? It is important to note for the bearish case that there is no positive stochastic divergence between the two lows of the correction. Neither is there a positive divergence with the moving average convergence/divergence (MACD) histogram. While not conclusive in and of itself, such a divergence in either case would have buttressed the bullish case. Compare this to the positive stochastic divergence that does exist (so far) in the Dow Jones transports (Figure 2). |

|
| Figure 2: The Dow transports seem to be indicating more upside in the short-term, courtesy of a short-term positive stochastic divergence. |
| Graphic provided by: eSignal. |
| |
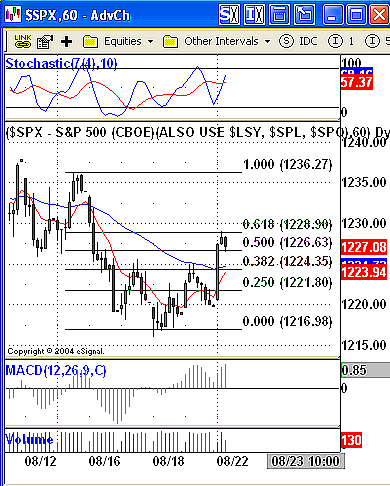
| Where the S&P 500 does find a positive stochastic divergence is on the hourly chart. The hourly chart in Figure 3 shows what the market was doing as it pulled back to the 50-day EMA. Note how, between August 16 and August 18, the $SPX made lower lows while the stochastic made higher lows. This positive divergence is what ended the slide in the $SPX--an ending aided and abetted by the presence of the 50-day EMA on the longer time frame. |

|
| Figure 3: Fibonacci retracement levels serve as resistance for the first and third legs of this countertrend bounce to the upside. First 0.382%, then 0.618% put temporary stops to the short-term move higher. |
| Graphic provided by: eSignal. |
| |
| Note also the technical character of the bounce. The first move up from the positive divergence finds resistance not only near a recent short-term high, but also at a 38.2% Fibonacci retracement level. From there, the market pulled back before moving higher in a three-wave correction to the previous downtrend. And what was the extent of the third leg? The 61.8% retracement level. |
Technical Writer for Technical Analysis of STOCKS & COMMODITIES magazine, Working-Money.com, and Traders.com Advantage.
| Title: | Technical Writer |
| Company: | Technical Analysis, Inc. |
| Address: | 4757 California Avenue SW |
| Seattle, WA 98116 | |
| Phone # for sales: | 206 938 0570 |
| Fax: | 206 938 1307 |
| Website: | www.Traders.com |
| E-mail address: | DPenn@traders.com |
Traders' Resource Links | |
| Charting the Stock Market: The Wyckoff Method -- Books | |
| Working-Money.com -- Online Trading Services | |
| Traders.com Advantage -- Online Trading Services | |
| Technical Analysis of Stocks & Commodities -- Publications and Newsletters | |
| Working Money, at Working-Money.com -- Publications and Newsletters | |
| Traders.com Advantage -- Publications and Newsletters | |
| Professional Traders Starter Kit -- Software | |
Click here for more information about our publications!
Comments
Date: 08/23/05Rank: 3Comment:

Request Information From Our Sponsors
- StockCharts.com, Inc.
- Candle Patterns
- Candlestick Charting Explained
- Intermarket Technical Analysis
- John Murphy on Chart Analysis
- John Murphy's Chart Pattern Recognition
- John Murphy's Market Message
- MurphyExplainsMarketAnalysis-Intermarket Analysis
- MurphyExplainsMarketAnalysis-Visual Analysis
- StockCharts.com
- Technical Analysis of the Financial Markets
- The Visual Investor
- VectorVest, Inc.
- Executive Premier Workshop
- One-Day Options Course
- OptionsPro
- Retirement Income Workshop
- Sure-Fire Trading Systems (VectorVest, Inc.)
- Trading as a Business Workshop
- VectorVest 7 EOD
- VectorVest 7 RealTime/IntraDay
- VectorVest AutoTester
- VectorVest Educational Services
- VectorVest OnLine
- VectorVest Options Analyzer
- VectorVest ProGraphics v6.0
- VectorVest ProTrader 7
- VectorVest RealTime Derby Tool
- VectorVest Simulator
- VectorVest Variator
- VectorVest Watchdog
