HOT TOPICS LIST
- MACD
- Fibonacci
- RSI
- Gann
- ADXR
- Stochastics
- Volume
- Triangles
- Futures
- Cycles
- Volatility
- ZIGZAG
- MESA
- Retracement
- Aroon
INDICATORS LIST
LIST OF TOPICS
PRINT THIS ARTICLE
by Arthur Hill
After a big move in early July, IBM consolidated the last few weeks, and a recent spark may start a continuation higher.
Position: Accumulate
Arthur Hill
Arthur Hill is currently editor of TDTrader.com, a website specializing in trading strategies, sector/industry specific breadth stats and overall technical analysis. He passed the Society of Technical Analysts (STA London) diploma exam with distinction is a Certified Financial Technician (CFTe). Prior to TD Trader, he was the Chief Technical Analyst for Stockcharts.com and the main contributor to the ChartSchool.
PRINT THIS ARTICLE
BOLLINGER BANDS
IBM Gets A Spark
08/22/05 08:00:53 AMby Arthur Hill
After a big move in early July, IBM consolidated the last few weeks, and a recent spark may start a continuation higher.
Position: Accumulate
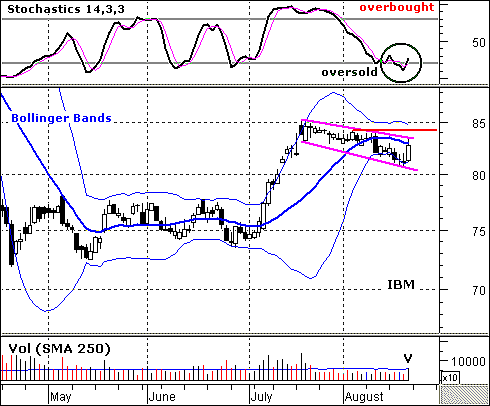
| The July surge created an overbought condition that needed to be alleviated. The stock surged from 73.45 to 85.11 in a few weeks and the stochastic oscillator moved above 80 (overbought). Overbought conditions can be worked off with a correction, a consolidation, or a little of both. IBM has chosen the latter route. |
| The decline over the last few weeks looks like a falling flag (magenta trendlines) (Figure 1). The decline is slight, as the stock declined only four points in the last 25 days. This makes it just as much a consolidation (flat) as a correction (decline). |

|
| Figure 1: The decline over the last few weeks looks like a falling flag. |
| Graphic provided by: MetaStock. |
| Graphic provided by: Reuters Data. |
| |
| Now that we have identified a falling flag, we must determine when it will end and what will trigger a bull signal. The stochastic oscillator moved back below 20 over the last two weeks. This is oversold territory and suggests that the falling flag is close to its end. In addition, the Bollinger Bands have contracted to their tightest point since late June, and such behavior usually precedes a move. |
| The stock bounced on good volume on Friday, but remains short of a breakout as IBM closed right near the middle band (20-day single moving average). Further strength above the upper flag trendline and the early August high (84.20) would provide a breakout and call for a continuation of the July advance. As long as the early August highs hold, the flag is falling, and we should respect the bears. |
Arthur Hill is currently editor of TDTrader.com, a website specializing in trading strategies, sector/industry specific breadth stats and overall technical analysis. He passed the Society of Technical Analysts (STA London) diploma exam with distinction is a Certified Financial Technician (CFTe). Prior to TD Trader, he was the Chief Technical Analyst for Stockcharts.com and the main contributor to the ChartSchool.
| Title: | Editor |
| Company: | TDTrader.com |
| Address: | Willem Geetsstraat 17 |
| Mechelen, B2800 | |
| Phone # for sales: | 3215345465 |
| Website: | www.tdtrader.com |
| E-mail address: | arthurh@tdtrader.com |
Traders' Resource Links | |
| TDTrader.com has not added any product or service information to TRADERS' RESOURCE. | |
Click here for more information about our publications!
Comments
Date: 08/23/05Rank: 4Comment:

Request Information From Our Sponsors
- StockCharts.com, Inc.
- Candle Patterns
- Candlestick Charting Explained
- Intermarket Technical Analysis
- John Murphy on Chart Analysis
- John Murphy's Chart Pattern Recognition
- John Murphy's Market Message
- MurphyExplainsMarketAnalysis-Intermarket Analysis
- MurphyExplainsMarketAnalysis-Visual Analysis
- StockCharts.com
- Technical Analysis of the Financial Markets
- The Visual Investor
- VectorVest, Inc.
- Executive Premier Workshop
- One-Day Options Course
- OptionsPro
- Retirement Income Workshop
- Sure-Fire Trading Systems (VectorVest, Inc.)
- Trading as a Business Workshop
- VectorVest 7 EOD
- VectorVest 7 RealTime/IntraDay
- VectorVest AutoTester
- VectorVest Educational Services
- VectorVest OnLine
- VectorVest Options Analyzer
- VectorVest ProGraphics v6.0
- VectorVest ProTrader 7
- VectorVest RealTime Derby Tool
- VectorVest Simulator
- VectorVest Variator
- VectorVest Watchdog
