HOT TOPICS LIST
- MACD
- Fibonacci
- RSI
- Gann
- ADXR
- Stochastics
- Volume
- Triangles
- Futures
- Cycles
- Volatility
- ZIGZAG
- MESA
- Retracement
- Aroon
INDICATORS LIST
LIST OF TOPICS
PRINT THIS ARTICLE
by David Penn
George Soros' fund is dumping energy stocks. Should you?
Position: N/A
David Penn
Technical Writer for Technical Analysis of STOCKS & COMMODITIES magazine, Working-Money.com, and Traders.com Advantage.
PRINT THIS ARTICLE
BREAKOUTS
Power Outage?
08/22/05 07:44:35 AMby David Penn
George Soros' fund is dumping energy stocks. Should you?
Position: N/A
| I wonder how many investors followed Warren Buffett's foray into forex speculation several months back. Buffett--like 95% of the Western world--was a big dollar bear even if he wasn't a veteran currency speculator. Nevertheless, over the past few years, everybody's favorite value equity investor has been betting against the greenback, citing trade deficits and a host of other economic circumstances. |
| Unfortunately, according to Jon Markman at MSN Money Central, Buffett "isn't sounding quite so smug anymore." Why? Because, as Markman puts it: "Normally an equity investor with liberal social views who rarely makes forays into the foreign exchange markets, he has had his head handed to him by more experienced currency players." |

|
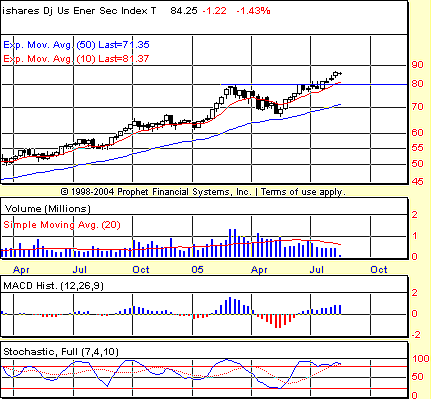
| Figure 1: Extended nearly 15 points above its 50-week EMA, the energy stocks iShares break to new highs, as a negative stochastic divergence appears to develop by late July. |
| Graphic provided by: Prophet Financial, Inc. |
| |
| So if the storyline is, essentially, "Veteran ballplayer loses big in boxing debut," what can investors make of uber-speculator George Soros' recent foray into (and, perhaps more important, out of) energy stocks? According to an article in CNN Money, Soros too has endured an uncharacteristic beat-down at the hands of the fickle markets. A look at the weekly chart of energy stocks (Figure 1)--as compiled by the energy sector iShare, IYE--shows that energy stocks as a group are extended, with IYE trading three points above its 10-week exponential moving average (EMA). With regard to the longer-term 50-week EMA, IYE appears all the more extended. |
| But is it time to bail? I've suggested elsewhere that it is possible that crude oil bulls may have entered the sort of pain-free zone that is characteristic of robust, secular bull markets ("A King-Sized Wave Count For Crude," Traders.com Advantage; August 9, 2005). By extension, that argument would suggest that as far as energy stocks are concerned, buying dips is likely to be a more promising trading practice than selling bounces. Just how extended are energy stocks? IYE broke out at about 80 on the weekly chart just after mid-month July and recently climbed as high as 5% above the breakout level. That in and of itself doesn't suggest overextension. However, IYE is beginning to display a running negative stochastic divergence, which could be hinting at weakness hidden in the summer move to new highs. |
| IYE made a weekly high in the first quarter of 2005, then went on to make a higher weekly high in the third quarter. However, the stochastic high in the third quarter was lower than the stochastic high in the first. That is the longer-term negative divergence. But there is also a shorter-term one. IYE made a weekly high late in the second quarter, then went on to make the higher weekly high in the third quarter already mentioned. The problem was that, at the same time, the weekly stochastic was making a lower high in the third quarter relative to the weekly stochastic high in the second quarter. That is the short-term negative divergence. This suggests, at minimum, that the upside is limited for IYE on an intermediate-term basis. The negative divergence could resolve itself either with sideways price action, perhaps finding support along the breakout level or along the 10-week EMA, both at about 80. Or the negative divergence could be resolved through sharper declines--such as a retracement to the 50-week EMA near 70. Support at this level also exists in the form of the April lows just below 70. |
Technical Writer for Technical Analysis of STOCKS & COMMODITIES magazine, Working-Money.com, and Traders.com Advantage.
| Title: | Technical Writer |
| Company: | Technical Analysis, Inc. |
| Address: | 4757 California Avenue SW |
| Seattle, WA 98116 | |
| Phone # for sales: | 206 938 0570 |
| Fax: | 206 938 1307 |
| Website: | www.Traders.com |
| E-mail address: | DPenn@traders.com |
Traders' Resource Links | |
| Charting the Stock Market: The Wyckoff Method -- Books | |
| Working-Money.com -- Online Trading Services | |
| Traders.com Advantage -- Online Trading Services | |
| Technical Analysis of Stocks & Commodities -- Publications and Newsletters | |
| Working Money, at Working-Money.com -- Publications and Newsletters | |
| Traders.com Advantage -- Publications and Newsletters | |
| Professional Traders Starter Kit -- Software | |
Click here for more information about our publications!
Comments
Date: 08/23/05Rank: 3Comment:
Date: 08/25/05Rank: 4Comment:

Request Information From Our Sponsors
- VectorVest, Inc.
- Executive Premier Workshop
- One-Day Options Course
- OptionsPro
- Retirement Income Workshop
- Sure-Fire Trading Systems (VectorVest, Inc.)
- Trading as a Business Workshop
- VectorVest 7 EOD
- VectorVest 7 RealTime/IntraDay
- VectorVest AutoTester
- VectorVest Educational Services
- VectorVest OnLine
- VectorVest Options Analyzer
- VectorVest ProGraphics v6.0
- VectorVest ProTrader 7
- VectorVest RealTime Derby Tool
- VectorVest Simulator
- VectorVest Variator
- VectorVest Watchdog
- StockCharts.com, Inc.
- Candle Patterns
- Candlestick Charting Explained
- Intermarket Technical Analysis
- John Murphy on Chart Analysis
- John Murphy's Chart Pattern Recognition
- John Murphy's Market Message
- MurphyExplainsMarketAnalysis-Intermarket Analysis
- MurphyExplainsMarketAnalysis-Visual Analysis
- StockCharts.com
- Technical Analysis of the Financial Markets
- The Visual Investor
