HOT TOPICS LIST
- MACD
- Fibonacci
- RSI
- Gann
- ADXR
- Stochastics
- Volume
- Triangles
- Futures
- Cycles
- Volatility
- ZIGZAG
- MESA
- Retracement
- Aroon
INDICATORS LIST
LIST OF TOPICS
PRINT THIS ARTICLE
by David Penn
Will the world's greatest search engine become the speculator's greatest short?
Position: N/A
David Penn
Technical Writer for Technical Analysis of STOCKS & COMMODITIES magazine, Working-Money.com, and Traders.com Advantage.
PRINT THIS ARTICLE
HEAD & SHOULDERS
Google's Head And Shoulders Top
08/19/05 08:55:28 AMby David Penn
Will the world's greatest search engine become the speculator's greatest short?
Position: N/A
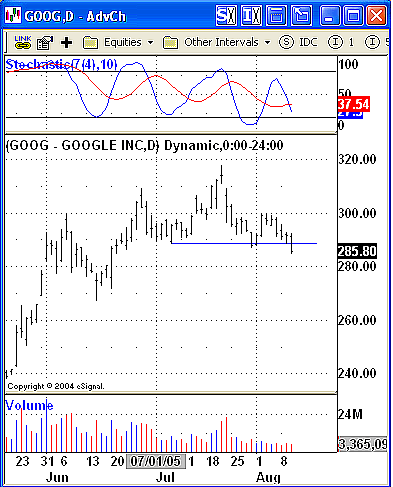
| You always hurt the one you love, the saying goes. And I couldn't help recalling that line when a colleague alerted me to the fact that Google (GOOG) just took out its July lows. That information led to a closer look at the stock and to the discovery of a head and shoulders top on the daily chart that looks like it just broke down. |
| Unlike many high-flying stocks of yesteryear, there aren't too many people with bad things to say about Google the company. I'm sure there are thousands of people who decided to go ahead and make Google their home page for no other reason than the fact that it is the handiest website out there for finding what you need to know about just about anything. Indeed, I echo hundreds of thousands of heavy-duty web surfers when I say, "Google, how do I love thee? Let me count the ways ..." |
| But nothing in the vastness of my affections for Google--or anybody else's, for that matter--will stand in the way of shorting this stock to kingdom come if the opportunity presents itself. And by some measures, that time just might be now. |

|
| Figure 1: Volume contracts as the head and shoulders top develops. Note how volume is higher on the left side of the pattern than it is on the right side. The violation of the July lows also appears to be the breakdown -- although volume remains slight. |
| Graphic provided by: eSignal. |
| |
| The head and shoulders top in Google consists of a left shoulder late in June, a head that encompasses the whole of July, and a rather stunted right shoulder that appears to have begun and ended in the first half of August (Figure 1). Volume, generally speaking, was higher on the left side of the pattern compared to the right side--which is a typical volume trend with head and shoulders tops. |
| The biggest flaw in this H&S top is the lack of volume on the breakdown. On the day of the breakout, the markets opened up big in the morning and slowly gave back all their gains (and then some) by the close. So there was a combination of bullishness and bearishness on the breakdown day in Google that might help account for the lack of volume on the breakdown from the H&S top. Speculators should look to see if the selling in the broader markets on the breakdown day (Wednesday, August 10) was met with more followthrough selling on Thursday and Friday (August 11 and 12). If that bearish followthrough to the downside occurs in the broader market, then it is hard to see why Google's breakdown would not follow suit with lower prices for GOOG. |
Technical Writer for Technical Analysis of STOCKS & COMMODITIES magazine, Working-Money.com, and Traders.com Advantage.
| Title: | Technical Writer |
| Company: | Technical Analysis, Inc. |
| Address: | 4757 California Avenue SW |
| Seattle, WA 98116 | |
| Phone # for sales: | 206 938 0570 |
| Fax: | 206 938 1307 |
| Website: | www.Traders.com |
| E-mail address: | DPenn@traders.com |
Traders' Resource Links | |
| Charting the Stock Market: The Wyckoff Method -- Books | |
| Working-Money.com -- Online Trading Services | |
| Traders.com Advantage -- Online Trading Services | |
| Technical Analysis of Stocks & Commodities -- Publications and Newsletters | |
| Working Money, at Working-Money.com -- Publications and Newsletters | |
| Traders.com Advantage -- Publications and Newsletters | |
| Professional Traders Starter Kit -- Software | |
Click here for more information about our publications!
Comments
Date: 08/19/05Rank: 3Comment:

Request Information From Our Sponsors
- VectorVest, Inc.
- Executive Premier Workshop
- One-Day Options Course
- OptionsPro
- Retirement Income Workshop
- Sure-Fire Trading Systems (VectorVest, Inc.)
- Trading as a Business Workshop
- VectorVest 7 EOD
- VectorVest 7 RealTime/IntraDay
- VectorVest AutoTester
- VectorVest Educational Services
- VectorVest OnLine
- VectorVest Options Analyzer
- VectorVest ProGraphics v6.0
- VectorVest ProTrader 7
- VectorVest RealTime Derby Tool
- VectorVest Simulator
- VectorVest Variator
- VectorVest Watchdog
- StockCharts.com, Inc.
- Candle Patterns
- Candlestick Charting Explained
- Intermarket Technical Analysis
- John Murphy on Chart Analysis
- John Murphy's Chart Pattern Recognition
- John Murphy's Market Message
- MurphyExplainsMarketAnalysis-Intermarket Analysis
- MurphyExplainsMarketAnalysis-Visual Analysis
- StockCharts.com
- Technical Analysis of the Financial Markets
- The Visual Investor
