HOT TOPICS LIST
- MACD
- Fibonacci
- RSI
- Gann
- ADXR
- Stochastics
- Volume
- Triangles
- Futures
- Cycles
- Volatility
- ZIGZAG
- MESA
- Retracement
- Aroon
INDICATORS LIST
LIST OF TOPICS
PRINT THIS ARTICLE
by David Penn
Could the first five waves of the next bear market have already begun?
Position: N/A
David Penn
Technical Writer for Technical Analysis of STOCKS & COMMODITIES magazine, Working-Money.com, and Traders.com Advantage.
PRINT THIS ARTICLE
ELLIOTT WAVE
The First Five Down?
08/19/05 08:26:27 AMby David Penn
Could the first five waves of the next bear market have already begun?
Position: N/A
| Those bears gone giddy with the call to battlestations that was issued by a number of technical trading setups and independent market timers must have found themselves clutching their chests when they woke up Wednesday, August 10, to find the Dow Jones industrials headed toward new highs. |
| However, in the absence of a new closing high, there is every reason to believe this move upward--coming a day after the Federal Reserve Board all but assured that there would be no deviation from their plan to relieve the market of the monetary accommodation with which Federal Reserve chairman Alan Greenspan has smothered the economy like white gravy on a plate of country-fried steak--is little more than a short-seller inspired reaction (none dare call it a squeeze) to the declines of recent days. |

|
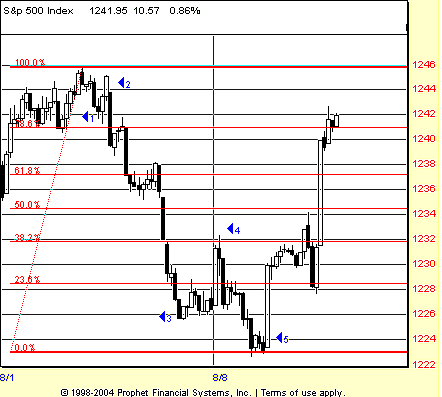
| Figure 1: The countertrend bounce that began on Wednesday sent the S&P 500 up past a 78.6% retracement of the previous decline. Such a powerful retracement would be characteristic of second waves. |
| Graphic provided by: Prophet Financial, Inc. |
| |
| In fact, it is possible to take this idea even further and suggest that the sharp rally higher is the second wave of what will be five surprisingly sharp moves downward as the market pulls back to test, potentially, the lows formed in the wake of the London terrorist bombings in early July. Figure 1 takes a look at what, in this scenario, would represent a wave 1 decline from the top on August 3 to the bottom on August 8. Initially, it is worth noting that the wave count has the "right look"--a factor that, while not conclusive in and of itself, still cannot be overlooked when trying to plot wave counts. Even the internal structure of what is shown here at wave 3 is supportive of the motive (as opposed to corrective) nature of the waves that took the Standard & Poor's 500 lower in early August. In some ways, the bounce higher on August 10 makes the previous decline that much clearer. Talking about the difference between motive and corrective waves in their book The Elliott Wave Principle, A.J. Frost and Robert Prechter note that, with the exception of waves in diagonal triangles, motive waves are five-segmented affairs while correctives never are. Moreover, the most common corrective form is some variation of a three-segmented A-B-C countertrend move. While the advance that began on August 10 has yet to be complete as of this writing, its movement clearly appears to be three-segmented--and thus corrective as opposed to motive. Other aspects of the advance support this argument--or will do so--such as any failure to establish a new high vis-a-vis the high of early August. |

|
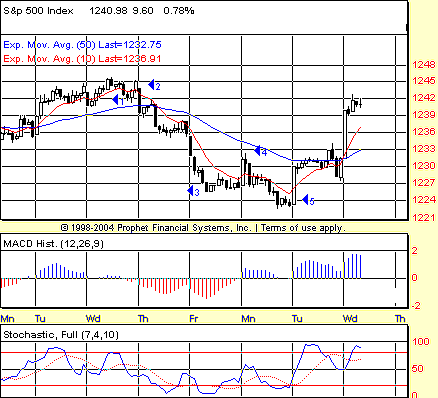
| Figure 2: A negative stochastic divergence takes the market down. Then a positive stochastic divergence takes the market back up. Now another stochastic divergence appears set to limit the upside progress of the two-day rally. |
| Graphic provided by: Prophet Financial, Inc. |
| |
| Many market technicians sympathetic to Elliott wave methods have pointed out that traditional technical tools like indicators and oscillators can be helpful in anticipating the sorts of significant turns that characterize EW analysis. For me, the stochastic has been helpful in marking what I called recently "true tops" and "true bottoms." Note how the high on Wednesday, August 3, is accompanied by a negative stochastic divergence--as well as a negative MACD histogram divergence. Even the bottom on Monday, August 8, was anticipated by a running positive stochastic divergence--a divergence that might have helped explain to bears and other short-side players what the sharp move upward on Wednesday was all about--at least from a technical perspective. |
| Just such a stochastic "tell" appears to have taken place on Wednesday as well--or at least so suggests the hourly chart of the S&P 500 shown in Figure 2. Note how the higher high in the S&P 500 from Tuesday to Wednesday is matched by lower highs in the stochastic shown below the chart. This suggests, at a minimum, that the upside right now is probably limited, and that subsequent price action will be sideways at best and decidedly downward at worst. |
Technical Writer for Technical Analysis of STOCKS & COMMODITIES magazine, Working-Money.com, and Traders.com Advantage.
| Title: | Technical Writer |
| Company: | Technical Analysis, Inc. |
| Address: | 4757 California Avenue SW |
| Seattle, WA 98116 | |
| Phone # for sales: | 206 938 0570 |
| Fax: | 206 938 1307 |
| Website: | www.Traders.com |
| E-mail address: | DPenn@traders.com |
Traders' Resource Links | |
| Charting the Stock Market: The Wyckoff Method -- Books | |
| Working-Money.com -- Online Trading Services | |
| Traders.com Advantage -- Online Trading Services | |
| Technical Analysis of Stocks & Commodities -- Publications and Newsletters | |
| Working Money, at Working-Money.com -- Publications and Newsletters | |
| Traders.com Advantage -- Publications and Newsletters | |
| Professional Traders Starter Kit -- Software | |
Click here for more information about our publications!
Comments
Date: 08/19/05Rank: 3Comment:

Request Information From Our Sponsors
- StockCharts.com, Inc.
- Candle Patterns
- Candlestick Charting Explained
- Intermarket Technical Analysis
- John Murphy on Chart Analysis
- John Murphy's Chart Pattern Recognition
- John Murphy's Market Message
- MurphyExplainsMarketAnalysis-Intermarket Analysis
- MurphyExplainsMarketAnalysis-Visual Analysis
- StockCharts.com
- Technical Analysis of the Financial Markets
- The Visual Investor
- VectorVest, Inc.
- Executive Premier Workshop
- One-Day Options Course
- OptionsPro
- Retirement Income Workshop
- Sure-Fire Trading Systems (VectorVest, Inc.)
- Trading as a Business Workshop
- VectorVest 7 EOD
- VectorVest 7 RealTime/IntraDay
- VectorVest AutoTester
- VectorVest Educational Services
- VectorVest OnLine
- VectorVest Options Analyzer
- VectorVest ProGraphics v6.0
- VectorVest ProTrader 7
- VectorVest RealTime Derby Tool
- VectorVest Simulator
- VectorVest Variator
- VectorVest Watchdog
