HOT TOPICS LIST
- MACD
- Fibonacci
- RSI
- Gann
- ADXR
- Stochastics
- Volume
- Triangles
- Futures
- Cycles
- Volatility
- ZIGZAG
- MESA
- Retracement
- Aroon
INDICATORS LIST
LIST OF TOPICS
PRINT THIS ARTICLE
by David Penn
Japanese candlestick patterns and classic indicators can combine for potent results.
Position: N/A
David Penn
Technical Writer for Technical Analysis of STOCKS & COMMODITIES magazine, Working-Money.com, and Traders.com Advantage.
PRINT THIS ARTICLE
CANDLESTICK CHARTING
Bears Engulfing Gas
08/19/05 07:40:55 AMby David Penn
Japanese candlestick patterns and classic indicators can combine for potent results.
Position: N/A
| Last night, Jim Cramer of Mad Money proclaimed a top in commodity prices. In a typically fascinating opening salvo, Cramer described a scenario in which prices for basic commodities like oil and copper had finally become too high for industrial consumers to bear (no pun intended). Cramer's observations extended beyond this, of course, to speculate on what falling commodity prices--a boon to consumers, at least on the surface--might mean for the economy going forward. But it was his notion, that commodity prices would likely not travel much higher in the near term, that was the key point. |
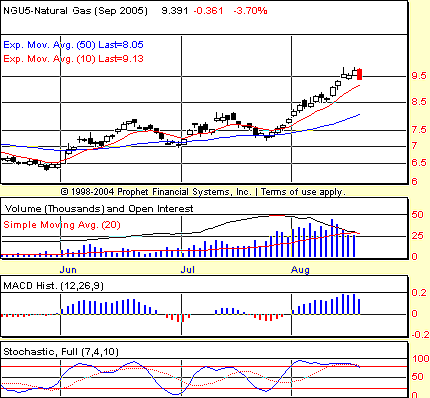
| Hours before Cramer's broadcast, I'd been looking at the chart of September natural gas futures shown in Figure 1. As you might guess, my attention was drawn to what appeared to be a bearish engulfing pattern at the close of Wednesday's trading. |

|
| Figure 1: Focusing on the "real bodies" of the Japanese candlesticks from the past few days, it is clear that Wednesday's selling created a bearish engulfing day that anticipated a reversal to the downside. |
| Graphic provided by: Prophet Financial, Inc. |
| |
Here's what Steve Nison, an expert in Japanese candlestick analysis, had to say about bearish engulfing patterns in his book Japanese Candlestick Charting Techniques:
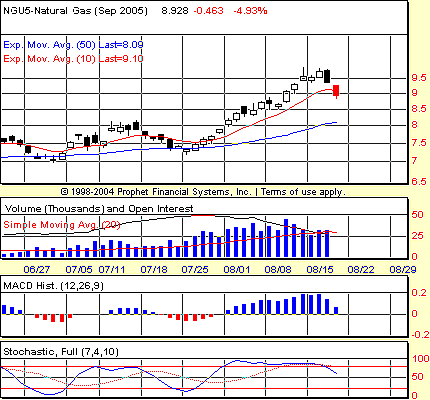
There are other contributing factors that Nison mentions, such as the size of the engulfing candlestick compared to the previous one, or the presence of heavy volume on the second, engulfing candlestick. But even in the absence of these contributing factors, it appears clear that September natural gas has formed a bearish engulfing pattern with Wednesday's closing low. This suggested strongly that a correction--or even a reversal--was imminent. Figure 2 is what September natural gas futures looked like a day later. |

|
| Figure 2: A negative stochastic divergence helps confirm the bearishness of the engulfing candlestick in mid-August. |
| Graphic provided by: Prophet Financial, Inc. |
| |
| A close to 5% day-to-day drop in the natural gas futures market is no move to sneeze at. What is particularly interesting about this bearish engulfing anticipated breakdown is that the bearishness of the engulfing candlestick was supported by bearish portents from the stochastic oscillator. Note how as natural gas prices made a high in early August and then a higher high by mid-month, the stochastic was making lower highs. This negative stochastic divergence developed at exactly the same time as the bearish engulfing pattern. Both were suggesting that the upside in September natural gas was limited and together they provided a real warning for alert traders--whether long the futures and looking to take profits, or on the sidelines watching for a chance to get short a short- to intermediate-term peak. |
| How could you have taken advantage of this combination of bearish patterns in the price bar/candlesticks and the stochastic? For me, shifts in the moving average convergence/divergence (MACD) histogram serve as triggers to establish entry points. In this case, either of the histogram reversals to the downside--from August 12 to August 15 or from August 16 to August 17--would have provided short entry points at 9.26 and 9.14, respectively, that would have been filled on August 18. As of the close of that day, a short entered at 9.26 was up 33 cents, or $3,300 per contract. A short entered at 9.14 was up 21 cents, or a more modest $2,100 a piece. |
Technical Writer for Technical Analysis of STOCKS & COMMODITIES magazine, Working-Money.com, and Traders.com Advantage.
| Title: | Technical Writer |
| Company: | Technical Analysis, Inc. |
| Address: | 4757 California Avenue SW |
| Seattle, WA 98116 | |
| Phone # for sales: | 206 938 0570 |
| Fax: | 206 938 1307 |
| Website: | www.Traders.com |
| E-mail address: | DPenn@traders.com |
Traders' Resource Links | |
| Charting the Stock Market: The Wyckoff Method -- Books | |
| Working-Money.com -- Online Trading Services | |
| Traders.com Advantage -- Online Trading Services | |
| Technical Analysis of Stocks & Commodities -- Publications and Newsletters | |
| Working Money, at Working-Money.com -- Publications and Newsletters | |
| Traders.com Advantage -- Publications and Newsletters | |
| Professional Traders Starter Kit -- Software | |
Click here for more information about our publications!
Comments
Date: 08/19/05Rank: 3Comment:
Date: 08/25/05Rank: 3Comment:
Date: 09/03/05Rank: 5Comment: The article is great.
Date: 04/29/08Rank: 5Comment:

Request Information From Our Sponsors
- StockCharts.com, Inc.
- Candle Patterns
- Candlestick Charting Explained
- Intermarket Technical Analysis
- John Murphy on Chart Analysis
- John Murphy's Chart Pattern Recognition
- John Murphy's Market Message
- MurphyExplainsMarketAnalysis-Intermarket Analysis
- MurphyExplainsMarketAnalysis-Visual Analysis
- StockCharts.com
- Technical Analysis of the Financial Markets
- The Visual Investor
- VectorVest, Inc.
- Executive Premier Workshop
- One-Day Options Course
- OptionsPro
- Retirement Income Workshop
- Sure-Fire Trading Systems (VectorVest, Inc.)
- Trading as a Business Workshop
- VectorVest 7 EOD
- VectorVest 7 RealTime/IntraDay
- VectorVest AutoTester
- VectorVest Educational Services
- VectorVest OnLine
- VectorVest Options Analyzer
- VectorVest ProGraphics v6.0
- VectorVest ProTrader 7
- VectorVest RealTime Derby Tool
- VectorVest Simulator
- VectorVest Variator
- VectorVest Watchdog
