HOT TOPICS LIST
- MACD
- Fibonacci
- RSI
- Gann
- ADXR
- Stochastics
- Volume
- Triangles
- Futures
- Cycles
- Volatility
- ZIGZAG
- MESA
- Retracement
- Aroon
INDICATORS LIST
LIST OF TOPICS
PRINT THIS ARTICLE
by David Penn
Like the S&P 500, the September greenback has found new support at old resistance.
Position: N/A
David Penn
Technical Writer for Technical Analysis of STOCKS & COMMODITIES magazine, Working-Money.com, and Traders.com Advantage.
PRINT THIS ARTICLE
CHANNEL LINES
Arsenic And Old Trend Channels
08/17/05 11:55:48 AMby David Penn
Like the S&P 500, the September greenback has found new support at old resistance.
Position: N/A
| What's that line? If you love someone, set them free, and if they return, it was meant to be? Like the Standard & Poor's 500, the September US dollar futures contract finds itself revisiting familiar haunts. In my last Traders.com Advantage piece, "The S&P 500's Kick Save at Support" (August 10, 2005), I noted how the $SPX had broken free from a trend channel in May, slipped back into that channel in late June, broken free for a second time from that channel in early July and, during the course of its correction in early August, found itself slipping back toward the old trend channel once again. |
| So far, the $SPX has managed to remain above the upper boundary of that old channel--in fact, turning that once-upon-a-time resistance into a source of support. |

|
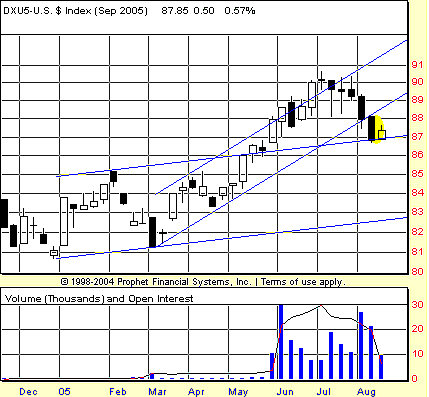
| Figure 1: This weekly chart of the September US dollar futures contract shows how old resistance has turned into new support. |
| Graphic provided by: Prophet Financial, Inc. |
| |
| Something similar has happened to the September US dollar futures contract in August. The DXU5 broke free from a relatively modest trend channel in May--in effect, creating a new trend channel that extends from the lows of early March well into July. In July, however, DXU5 began to slip, and by August, the September greenback had broken down below the lower boundary of its newest trend channel. Volume on the breakdown, as Figure 1 makes clear, was significant--exceeded only by the volume early in June, as the uptrend was likely in its most powerful phase. |
| Having long made the case for a cyclical bull market in the dollar, I find this current correction to be, potentially, a very telling one. If in fact the dollar is to move meaningfully higher--after its already impressive "third wave"-like run from mid-March to late June--then finding support on the back of this old trend channel would be one sound way to do it. Not only is their residual support from the upper boundary of the old trend channel, but also there is potential resistance-turned-support in the form of the February and April highs at 85.18 and 85.15, respectively. See Figure 2. |

|
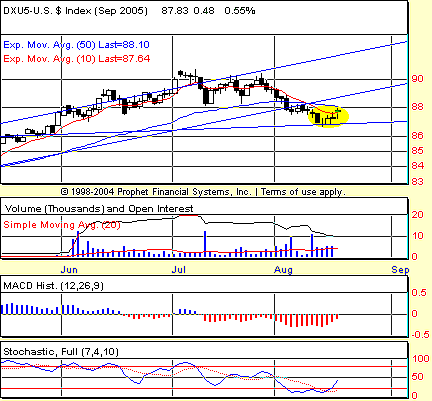
| Figure 2: While the upper boundary of the old trend channel now provides support, the lower boundary of the newer trend channel is poised to provide resistance. |
| Graphic provided by: Prophet Financial, Inc. |
| |
| There are a few other worthwhile technical notes to make with regard to the bounce that DXU5 is attempting. The 10-day exponential moving average (EMA) and the 50-day EMA are at this moment within one point of DXU5's current price, with the former almost providing support and the latter creating potential resistance above. In addition, the lower boundary of the newer trend channel--the trend channel that began with the March lows--which served as a source of support early in the greenback's accelerated advance in late April and early May, now appears set to play the role of resistance as the September dollar works to move higher. |
Technical Writer for Technical Analysis of STOCKS & COMMODITIES magazine, Working-Money.com, and Traders.com Advantage.
| Title: | Technical Writer |
| Company: | Technical Analysis, Inc. |
| Address: | 4757 California Avenue SW |
| Seattle, WA 98116 | |
| Phone # for sales: | 206 938 0570 |
| Fax: | 206 938 1307 |
| Website: | www.Traders.com |
| E-mail address: | DPenn@traders.com |
Traders' Resource Links | |
| Charting the Stock Market: The Wyckoff Method -- Books | |
| Working-Money.com -- Online Trading Services | |
| Traders.com Advantage -- Online Trading Services | |
| Technical Analysis of Stocks & Commodities -- Publications and Newsletters | |
| Working Money, at Working-Money.com -- Publications and Newsletters | |
| Traders.com Advantage -- Publications and Newsletters | |
| Professional Traders Starter Kit -- Software | |
Click here for more information about our publications!
Comments
Date: 08/17/05Rank: 5Comment:
Date: 08/18/05Rank: 5Comment:
Date: 08/18/05Rank: 3Comment:

Request Information From Our Sponsors
- StockCharts.com, Inc.
- Candle Patterns
- Candlestick Charting Explained
- Intermarket Technical Analysis
- John Murphy on Chart Analysis
- John Murphy's Chart Pattern Recognition
- John Murphy's Market Message
- MurphyExplainsMarketAnalysis-Intermarket Analysis
- MurphyExplainsMarketAnalysis-Visual Analysis
- StockCharts.com
- Technical Analysis of the Financial Markets
- The Visual Investor
- VectorVest, Inc.
- Executive Premier Workshop
- One-Day Options Course
- OptionsPro
- Retirement Income Workshop
- Sure-Fire Trading Systems (VectorVest, Inc.)
- Trading as a Business Workshop
- VectorVest 7 EOD
- VectorVest 7 RealTime/IntraDay
- VectorVest AutoTester
- VectorVest Educational Services
- VectorVest OnLine
- VectorVest Options Analyzer
- VectorVest ProGraphics v6.0
- VectorVest ProTrader 7
- VectorVest RealTime Derby Tool
- VectorVest Simulator
- VectorVest Variator
- VectorVest Watchdog
