HOT TOPICS LIST
- MACD
- Fibonacci
- RSI
- Gann
- ADXR
- Stochastics
- Volume
- Triangles
- Futures
- Cycles
- Volatility
- ZIGZAG
- MESA
- Retracement
- Aroon
INDICATORS LIST
LIST OF TOPICS
PRINT THIS ARTICLE
by Gary Grosschadl
This stock has made a strong move up since breaking past the $20 level, but now it's looking toppy.
Position: Sell
Gary Grosschadl
Independent Canadian equities trader and technical analyst based in Peterborough
Ontario, Canada.
PRINT THIS ARTICLE
HEAD & SHOULDERS
Topping Pattern For Freescale Semiconductor Inc.
08/17/05 07:43:47 AMby Gary Grosschadl
This stock has made a strong move up since breaking past the $20 level, but now it's looking toppy.
Position: Sell
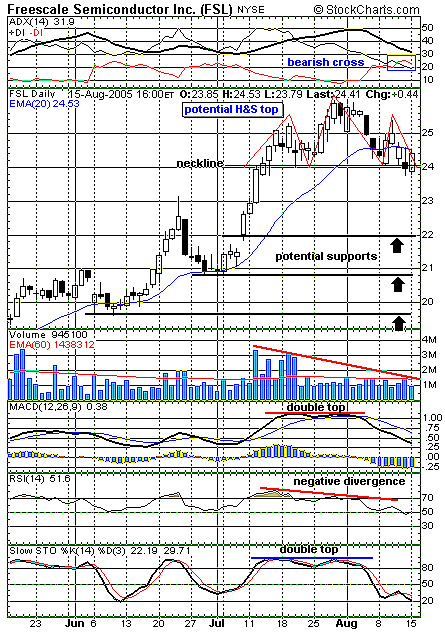
| Often, the head and shoulders pattern is a strong visual cue about a potential topping pattern with its tell-tale humanistic triple peak. The reaction lows of each peak can be connected to form a neckline of support. |
| The volume pattern here is classic for this type of formation. The volume at the first peak is higher than subsequent peaks, a visual display of waning bullishness. The next volume cue would be an increase or spike in volume as the stock breaks under the neckline. |

|
| Figure 1: The daily chart of FSL suggests a topping pattern. |
| Graphic provided by: StockCharts.com. |
| |
| Figure 1 shows three potential support targets, the first one being the traditional "measured" target. The distance between the very top of the pattern and the neckline, as applied to the downside break of the neckline, brings us to the $22 level. Note this also relates to the top of a previous gap. The lower targets relate to previous support levels below $22 and $21. |
| Several indicators are worthy of comment. At the top of the chart, the components of the directional movement indicator show two bearish developments. First off, the average directional index (ADX) has peaked and declined, marking a reversal of strength for the previous trend. Second, the DIs have reversed, showing bearish strength growing (-DI) while bullish strength diminishes (+DI). The indicators show two double top formations for the relative strength index (RSI) and the stochastics oscillator. In addition, note the negative divergence to price action shown by the moving average convergence/divergence (MACD). |
| Look for the 20-day exponential moving average (EMA) to be "boss resistance" should a breakdown occur as the moving average line of the previous support level switches to resistance. Stocks that break down often show future failure moves to this overhead resistance line. |
Independent Canadian equities trader and technical analyst based in Peterborough
Ontario, Canada.
| Website: | www.whatsonsale.ca/financial.html |
| E-mail address: | gwg7@sympatico.ca |
Click here for more information about our publications!
Comments
Date: 08/18/05Rank: 5Comment:

Request Information From Our Sponsors
- StockCharts.com, Inc.
- Candle Patterns
- Candlestick Charting Explained
- Intermarket Technical Analysis
- John Murphy on Chart Analysis
- John Murphy's Chart Pattern Recognition
- John Murphy's Market Message
- MurphyExplainsMarketAnalysis-Intermarket Analysis
- MurphyExplainsMarketAnalysis-Visual Analysis
- StockCharts.com
- Technical Analysis of the Financial Markets
- The Visual Investor
- VectorVest, Inc.
- Executive Premier Workshop
- One-Day Options Course
- OptionsPro
- Retirement Income Workshop
- Sure-Fire Trading Systems (VectorVest, Inc.)
- Trading as a Business Workshop
- VectorVest 7 EOD
- VectorVest 7 RealTime/IntraDay
- VectorVest AutoTester
- VectorVest Educational Services
- VectorVest OnLine
- VectorVest Options Analyzer
- VectorVest ProGraphics v6.0
- VectorVest ProTrader 7
- VectorVest RealTime Derby Tool
- VectorVest Simulator
- VectorVest Variator
- VectorVest Watchdog
