HOT TOPICS LIST
- MACD
- Fibonacci
- RSI
- Gann
- ADXR
- Stochastics
- Volume
- Triangles
- Futures
- Cycles
- Volatility
- ZIGZAG
- MESA
- Retracement
- Aroon
INDICATORS LIST
LIST OF TOPICS
PRINT THIS ARTICLE
by Paolo Pezzutti
Statistics provide elements for successful strategies.
Position: N/A
Paolo Pezzutti
Author of the book "Trading the US Markets - A Comprehensive Guide to US Markets for International Traders and Investors" - Harriman House (July 2008)
PRINT THIS ARTICLE
STATISTICS
Short-Term Strategies: Fading The Gap
08/15/05 07:36:52 AMby Paolo Pezzutti
Statistics provide elements for successful strategies.
Position: N/A
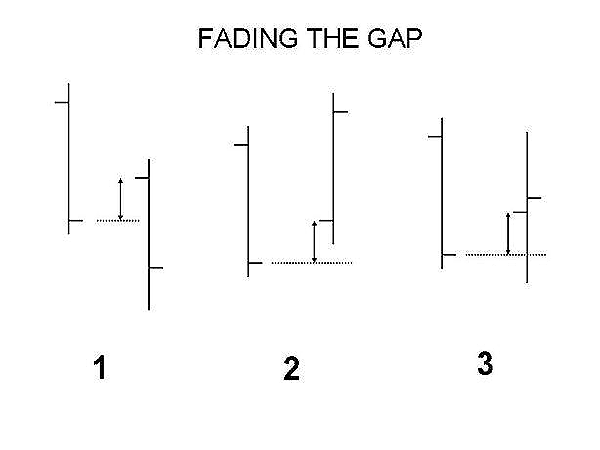
| Many daytraders and short-term traders fear the opening gap so much that it is their primary motivation not to carry positions overnight. A gap is a term used when a financial asset opens at a higher or lower price than it closed the prior day: the empty space from yesterday's close to today's open. It is the technical assumption that all information known about a stock or commodity is reflected in the price at any given moment. Prices will not significantly change until some new perception of the future value of the stock or commodity enters the marketplace. Gaps are the result of some event happening while the market is closed. Price can change also because of noise, which, depending on the asset, can have different contributions to the single bar range. Whatever the reason, the result is the buying or selling pressure at the open of the next day, which will make the asset open at a different price than where it closed. Most traders are at their terminals long before the opening; for daytraders and short-erm traders, the opening is the most important time of the day. The opening gap is often perceived as a risk, but it can also be an opportunity for profit: fading the gap. |

|
| Figure 1: Fading the gap--trading scenarios |
| Graphic provided by: PowerPoint. |
| |
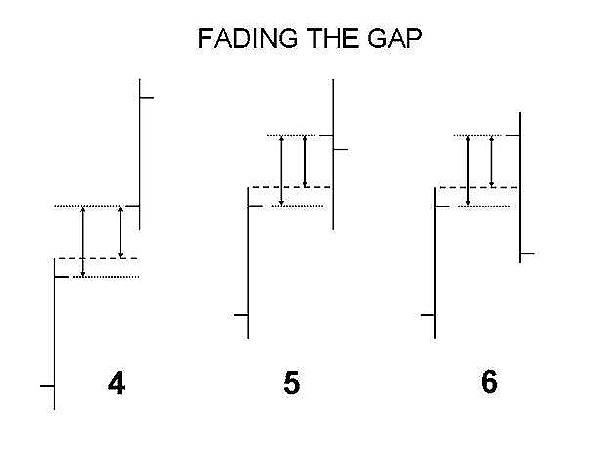
| There is a tendency to close opening gaps. It is widely believed that if the gap is not faded within the first hour, then it is likely that the market will accelerate in the direction of the gap and close considerably away from the opening. Moreover, when opening gaps are filled, the market usually reverses and trades in the direction of the gap. In this article, I do not look for confirmation of these particular assumptions. Instead, I have used statistics to see if the opening gap is filled by the end of the day. |

|
| Figure 2: Fading the gap--trading scenarios |
| Graphic provided by: PowerPoint. |
| |
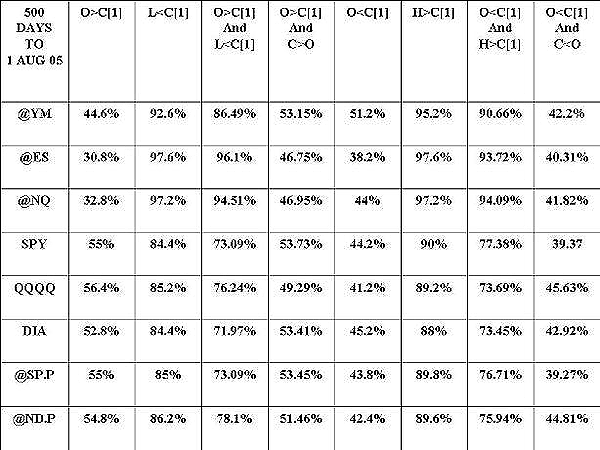
| Let's analyze the results of statistics conducted on a sample of 500 trading sessions (last on August 1, 2005) on a different set of assets: emini Dow (YM), emini S&P (ES), emini Nasdaq (NQ), SPY, QQQQ, DIA, the S&P future contract (SP.P), and the NASDAQ future contract (ND.P). Generally, behaviors differ between the emini contracts and the SPY, QQQQ, DIA, S&P, and NASDAQ futures. Note that: - The condition open < close of the previous day presents similar results across the assets: on average below 50%. - The condition open > close of the previous day presents considerably higher and consistent results in favor of the SPY, QQQQ, S&P, and NASDAQ futures contract: between 53% and 56% against about 30-40% for the emini group. - The condition low < close of the previous day presents much better results for the emini contracts: between 92.6% and 97.6%. The other assets have results ranging between about 84% and 86%: almost 10 % percent less! - The same results were found for the condition high>close of the previous day. For the emini contracts, the condition is met about 95%-97.5% of the times; the other assets about 88-90%. - I tested a positive opening gap to see how often it is filled. This is useful to build a "fade the gap" program. The condition open>close of the previous day and low - I tested if a positive gap has an influence on the close of the day. I did the testing on the condition open>close of the previous day and close>open. In this case, the results are similar for all the assets with a slight positive tendency. - The negative gap did not provide confirmation of the same type of behavior. The results are well below 50%. They ranged between 39.3% and 44.8%. |

|
| Figure 3: Fading the gap--statistics |
| Graphic provided by: PowerPoint. |
| |
| Some considerations: - There is a considerable difference in behavior between the emini group of contracts and the other financial assets. This might be due to the different players in the market and/or the technical characteristics of the market. In any case, it seems that fading the gap is a better strategy on emini contracts. - The test provides a base for scalping strategies, that profit from the overnight gap. - The anomaly of behavior between assets is consistent over time. - The study is a first approach to conceptualize on the different trading scenarios and tactics. |
| If you look for high-probability trades, fading gaps (maybe even a partial fill) can be part of your set of short- term strategies. A protecting stop must be in place. If you want to increase further your probabilities for a winning trade, you can fade only gaps with specific requirements (for example, big gaps or opening gaps within the previous day's range), depending on your strategy. Gap size, volume, important news, preopen volumes, sector analysis, other indexes' behavior, and market conditions (trend versus congestion) are some of the elements that can be taken into account. Often, increasing winning probabilities means reducing the average profit with commissions eroding gains. It is a tradeoff that must be accurately evaluated. |
Author of the book "Trading the US Markets - A Comprehensive Guide to US Markets for International Traders and Investors" - Harriman House (July 2008)
| Address: | VIA ROBERTO AGO 26 POSTAL CODE 00166 |
| Rome, ITALY | |
| Phone # for sales: | +393357540708 |
| E-mail address: | pezzutti.paolo@tiscali.it |
Click here for more information about our publications!
Comments
Date: 08/16/05Rank: 3Comment:

Request Information From Our Sponsors
- StockCharts.com, Inc.
- Candle Patterns
- Candlestick Charting Explained
- Intermarket Technical Analysis
- John Murphy on Chart Analysis
- John Murphy's Chart Pattern Recognition
- John Murphy's Market Message
- MurphyExplainsMarketAnalysis-Intermarket Analysis
- MurphyExplainsMarketAnalysis-Visual Analysis
- StockCharts.com
- Technical Analysis of the Financial Markets
- The Visual Investor
- VectorVest, Inc.
- Executive Premier Workshop
- One-Day Options Course
- OptionsPro
- Retirement Income Workshop
- Sure-Fire Trading Systems (VectorVest, Inc.)
- Trading as a Business Workshop
- VectorVest 7 EOD
- VectorVest 7 RealTime/IntraDay
- VectorVest AutoTester
- VectorVest Educational Services
- VectorVest OnLine
- VectorVest Options Analyzer
- VectorVest ProGraphics v6.0
- VectorVest ProTrader 7
- VectorVest RealTime Derby Tool
- VectorVest Simulator
- VectorVest Variator
- VectorVest Watchdog
