

HOT TOPICS LIST
- MACD
- Fibonacci
- RSI
- Gann
- ADXR
- Stochastics
- Volume
- Triangles
- Futures
- Cycles
- Volatility
- ZIGZAG
- MESA
- Retracement
- Aroon
INDICATORS LIST
LIST OF TOPICS
PRINT THIS ARTICLE
by David Penn
Starbucks (NYSE: SBUX) looks well-positioned to test record highs in the neighborhood of 45 1/4 given its intermediate price momentum since May. A solid 10-day horizontal formation in the 39/40 area represents the early stages of a consolidation area that could be the springboard for a further climb.
Position: Buy
David Penn
Technical Writer for Technical Analysis of STOCKS & COMMODITIES magazine, Working-Money.com, and Traders.com Advantage.
PRINT THIS ARTICLE
CONSOLID FORMATION
Starbucks: Figure Charting For Price Support
07/24/00 12:49:38 PMby David Penn
Starbucks (NYSE: SBUX) looks well-positioned to test record highs in the neighborhood of 45 1/4 given its intermediate price momentum since May. A solid 10-day horizontal formation in the 39/40 area represents the early stages of a consolidation area that could be the springboard for a further climb.
Position: Buy
| The quickest way to assess the present technical price strength of SBUX is by a figure chart. Recall that a figure chart is intended to provide information with regard to three principle developments: price movement, general formations and horizontal formations. |
| With regard to price movement, the figure chart provides a highly accurate journal of price points of resistance and supply. The formations inherent in figure charts reveal a number of characteristics--from areas of accumulation (stock moving into stronger, more certain hands) and distribution (stock moving into weaker, less certain hands), to clues as to the likely breadth of SBUX's next market move. Figure 1 shows SBUX's figure-chart (daily low-to-high share prices) for June 2000. |
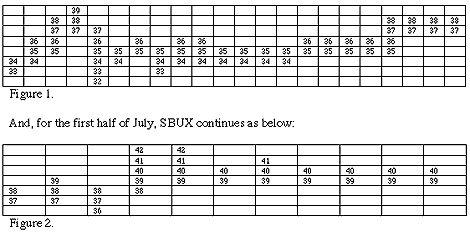
|
| |
| From the top figure chart, we can see the strong horizontal formation that has developed at 35, a pattern that--combined with early June patterns--continues for a total of 18 days in June before breaking into higher territory in July. Based on this 18-day horizontal formation, we might expect a near-term high of as much as 50 (with a potential downside bottom of 18). "Near-term high" and "potential downside" opinions are based on Wyckoff figure charting principles that suggest that adding the duration of a horizontal formation to recent highs and lows is an effective indicator of future price movement potential up or down. The lower figure chart shows two things in particular. First, the price range for SBUX continues to be rather small, reflecting an equilibrium between buying and selling forces. While not quite the 18-day horizontal formation seen in June, SBUX is already beginning to form a solid 10-day horizontal formation 4-5 points higher than June's formation. These developments in July suggest a high of as much as 56, with a potential downside bottom of 32 when SBUX breaks formation. |
| What the horizontal formation represents is a temporary stand-off between sellers and buyers. A number of things may be happening during this consolidation. Generally speaking, when such developments form at the top of a rally, the formation is likely to be a distribution pattern, with strong holders selling to weak buyers. However, the question is: has SBUX reached a top? Unfortunately, there is no way of telling for sure whether or not a particular formation is suggestive of an impending advance or decline. Highs can beget new highs, not just declines, and the same is true with lows. The only general guideline that can help here is the one that suggests that, in effect, a trend is a trend until it ends. Until a preponderance of the evidence suggests otherwise, it should always be assumed that the prevailing trend is still in place. In the case of SBUX, the prevailing intermediate trend over the past several weeks is bullish. |
| In any event, one thing that is certain is that the market is storing up energy for a new move, and every day that passes within the current horizontal formation makes the inevitable move all the more powerful and long-lasting. The next look at Starbucks will combine the price information gained through the use of figure charts with a look at Starbucks' primary and intermediate trends to determine the likelihood that SBUX will set new highs in the fall of 2000. |
Technical Writer for Technical Analysis of STOCKS & COMMODITIES magazine, Working-Money.com, and Traders.com Advantage.
| Title: | Technical Writer |
| Company: | Technical Analysis, Inc. |
| Address: | 4757 California Avenue SW |
| Seattle, WA 98116 | |
| Phone # for sales: | 206 938 0570 |
| Fax: | 206 938 1307 |
| Website: | www.Traders.com |
| E-mail address: | DPenn@traders.com |
Traders' Resource Links | |
| Charting the Stock Market: The Wyckoff Method -- Books | |
| Working-Money.com -- Online Trading Services | |
| Traders.com Advantage -- Online Trading Services | |
| Technical Analysis of Stocks & Commodities -- Publications and Newsletters | |
| Working Money, at Working-Money.com -- Publications and Newsletters | |
| Traders.com Advantage -- Publications and Newsletters | |
| Professional Traders Starter Kit -- Software | |
Click here for more information about our publications!
Comments

Request Information From Our Sponsors
- StockCharts.com, Inc.
- Candle Patterns
- Candlestick Charting Explained
- Intermarket Technical Analysis
- John Murphy on Chart Analysis
- John Murphy's Chart Pattern Recognition
- John Murphy's Market Message
- MurphyExplainsMarketAnalysis-Intermarket Analysis
- MurphyExplainsMarketAnalysis-Visual Analysis
- StockCharts.com
- Technical Analysis of the Financial Markets
- The Visual Investor
- VectorVest, Inc.
- Executive Premier Workshop
- One-Day Options Course
- OptionsPro
- Retirement Income Workshop
- Sure-Fire Trading Systems (VectorVest, Inc.)
- Trading as a Business Workshop
- VectorVest 7 EOD
- VectorVest 7 RealTime/IntraDay
- VectorVest AutoTester
- VectorVest Educational Services
- VectorVest OnLine
- VectorVest Options Analyzer
- VectorVest ProGraphics v6.0
- VectorVest ProTrader 7
- VectorVest RealTime Derby Tool
- VectorVest Simulator
- VectorVest Variator
- VectorVest Watchdog