HOT TOPICS LIST
- MACD
- Fibonacci
- RSI
- Gann
- ADXR
- Stochastics
- Volume
- Triangles
- Futures
- Cycles
- Volatility
- ZIGZAG
- MESA
- Retracement
- Aroon
INDICATORS LIST
LIST OF TOPICS
PRINT THIS ARTICLE
by Paolo Pezzutti
Prices have little directionality and low volatility.
Position: N/A
Paolo Pezzutti
Author of the book "Trading the US Markets - A Comprehensive Guide to US Markets for International Traders and Investors" - Harriman House (July 2008)
PRINT THIS ARTICLE
TECHNICAL ANALYSIS
Walt Disney Company: The Entertainment Leader
08/11/05 01:56:06 PMby Paolo Pezzutti
Prices have little directionality and low volatility.
Position: N/A
| On August 9, The Walt Disney Co. reported earnings for the quarter and nine months ended July 2, 2005, amid news reports concerning lawsuits over the firing of departing Disney chief executive Michael Eisner. Diluted earnings per share (EPS) for the third quarter increased 41% to $0.41, compared to $0.29 in the prior-year quarter. For the nine-month period, EPS was $1.09, up 24% compared to $0.88 recorded in the prior-year period, posting a quarter of strong growth. |
| The main price movement components are directionality and volatility. From the combination of these elements, we can define the following four market states: - High directionality - low volatility - High directionality - high volatility - Low directionality - high volatility - Low directionality - low volatility. To analyze the Disney technical states, I will use: - ADX (average directional movement index). This indicator measures the strength of a prevailing trend as well as whether movement exists in the market. The greater the ADX value, the stronger a security is trending. Traditionally, it is said that values above 30 indicate an ongoing trend. A low ADX value can indicate a nontrending market. - Volatility expressed as the ratio between the average true range (n) and the average of the last n daily closes; this is what I refer to as speed (see my August 9th article). |

|
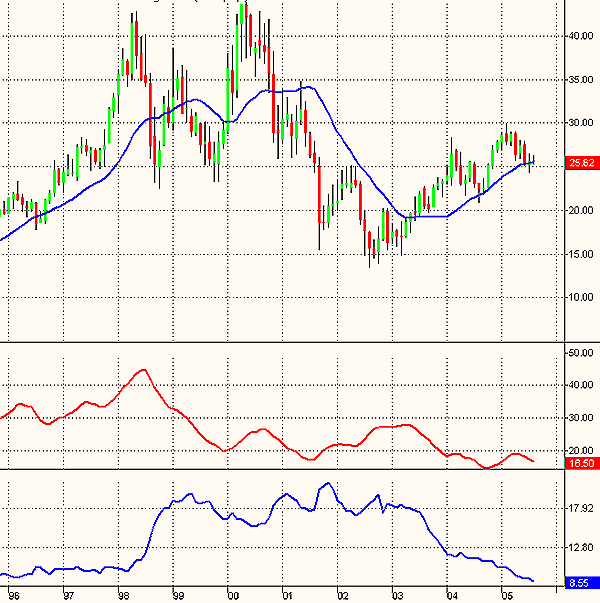
| Figure 1: The Disney monthly chart prints a low in volatility. |
| Graphic provided by: TradeStation. |
| |
| In the long term (Figure 1), Disney started an uptrend at the beginning of the 1990s. From $10 levels, the stock price reached $42.80 in May 1998. The retest of this high in May 2000 was a failure and printed a double top. Prices started a deep correction until the low of $13.48 at the end of August 2002. During the past three years, prices doubled and printed a high at $29.99 last February. Volatility has been going down throughout the period. The ADX is printing a low value of 16.50. The up leg of the past years happened in an environment characterized by low directionality and low volatility. |

|
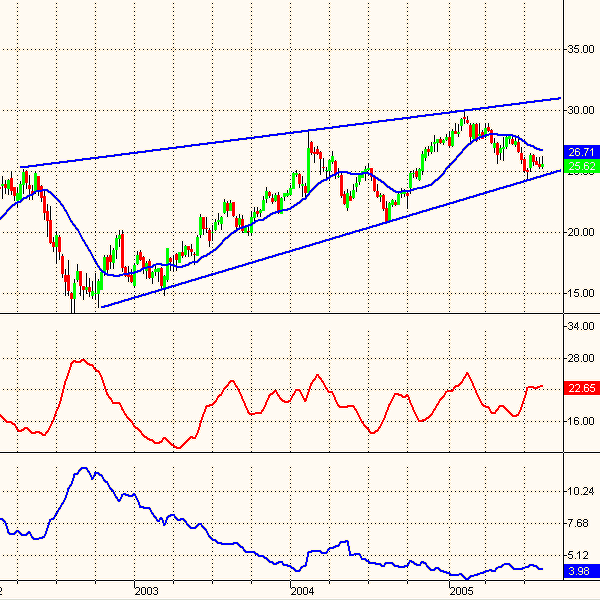
| Figure 2: On the weekly chart, Disney is testing the lower trendline. |
| Graphic provided by: TradeStation. |
| |
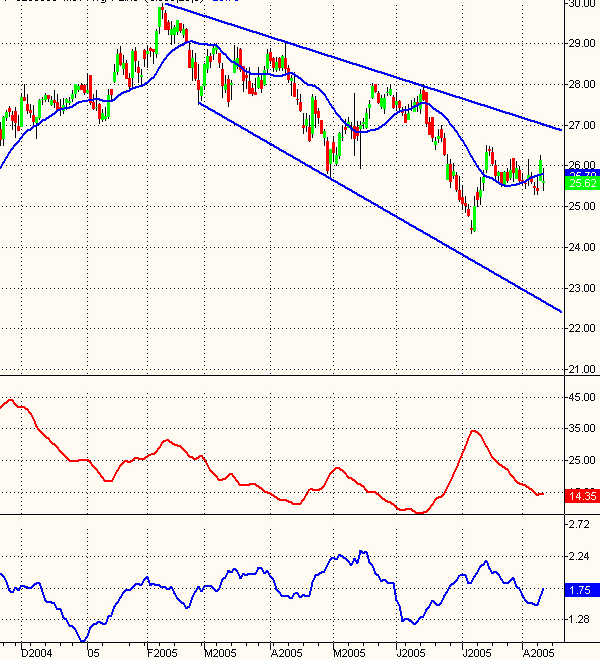
| This situation is confirmed also at the weekly level (Figure 2). Prices during the past three years moved upward in a positively inclined channel. Volatility has been going down throughout the period. The trendlines that limit the large channel are converging. Prices are now testing the supports of the channel. In the daily chart (Figure 3), you can see the downtrend started after the high of February 2. Prices are moving within a negatively inclined channel, characterized by diverging trendlines. During the last downleg, prices did not manage to reach the lower trendline. After the correction from the low of July 7 to the relative high of July 14, prices started a lateral movement. |

|
| Figure 3: Walt Disney daily chart |
| Graphic provided by: TradeStation. |
| |
| Similar to most other stocks, Disney has developed a significant recovery of prices in recent years. The up movement is still ongoing in a low volatility and directionality environment. At this stage, I would expect an expansion in volatility, although it is quite difficult to say when this is going to happen. These phases can be quite long. In the longer time frames, prices are now at their support levels. At the daily level, the stock in the past 20 trading sessions has been developing a congested phase. From here, a new trend will emerge with an increase in volatility and directionality. When deciding their strategies, traders must take it into account. |
Author of the book "Trading the US Markets - A Comprehensive Guide to US Markets for International Traders and Investors" - Harriman House (July 2008)
| Address: | VIA ROBERTO AGO 26 POSTAL CODE 00166 |
| Rome, ITALY | |
| Phone # for sales: | +393357540708 |
| E-mail address: | pezzutti.paolo@tiscali.it |
Click here for more information about our publications!
Comments
Date: 08/13/05Rank: 3Comment:
Date: 08/16/05Rank: 5Comment:

|

Request Information From Our Sponsors
- StockCharts.com, Inc.
- Candle Patterns
- Candlestick Charting Explained
- Intermarket Technical Analysis
- John Murphy on Chart Analysis
- John Murphy's Chart Pattern Recognition
- John Murphy's Market Message
- MurphyExplainsMarketAnalysis-Intermarket Analysis
- MurphyExplainsMarketAnalysis-Visual Analysis
- StockCharts.com
- Technical Analysis of the Financial Markets
- The Visual Investor
- VectorVest, Inc.
- Executive Premier Workshop
- One-Day Options Course
- OptionsPro
- Retirement Income Workshop
- Sure-Fire Trading Systems (VectorVest, Inc.)
- Trading as a Business Workshop
- VectorVest 7 EOD
- VectorVest 7 RealTime/IntraDay
- VectorVest AutoTester
- VectorVest Educational Services
- VectorVest OnLine
- VectorVest Options Analyzer
- VectorVest ProGraphics v6.0
- VectorVest ProTrader 7
- VectorVest RealTime Derby Tool
- VectorVest Simulator
- VectorVest Variator
- VectorVest Watchdog
