HOT TOPICS LIST
- MACD
- Fibonacci
- RSI
- Gann
- ADXR
- Stochastics
- Volume
- Triangles
- Futures
- Cycles
- Volatility
- ZIGZAG
- MESA
- Retracement
- Aroon
INDICATORS LIST
LIST OF TOPICS
PRINT THIS ARTICLE
by Koos van der Merwe
What now for Transmeta?
Position: Buy
Koos van der Merwe
Has been a technical analyst since 1969, and has worked as a futures and options trader with First Financial Futures in Johannesburg, South Africa.
PRINT THIS ARTICLE
TECHNICAL ANALYSIS
Trading Transmeta
08/12/05 07:42:38 AMby Koos van der Merwe
What now for Transmeta?
Position: Buy
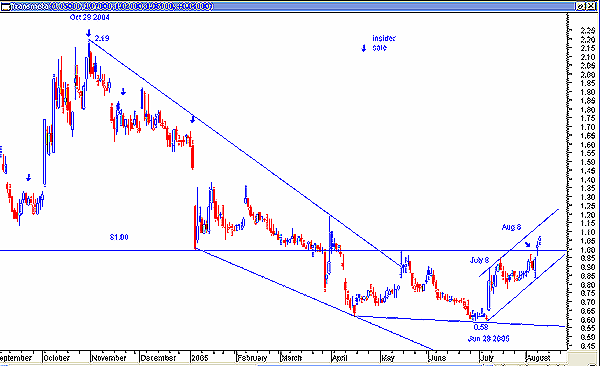
| Earlier this year, Transmeta was almost delisted from NASDAQ because its share price dropped dramatically after an analyst at a prominent brokerage house gave it a poor rating. Since then, the company has recovered almost as dramatically. Figure 1 shows how the share price dropped from a high of $2.19 on October 29, 2004, to a low of $0.58 by June 28, 2005. Then suddenly the company started to recover, and in one day the price jumped from $0.65 to $0.82. I have also shown arrows highlighting the times of insider sales. There were no insider purchases. Note the resistance/support at the $1.00 level. Also note how the share price broke above this resistance and on a gap on August 8. |

|
| Figure1: Transmeta daily chart |
| Graphic provided by: MetaStock. |
| |
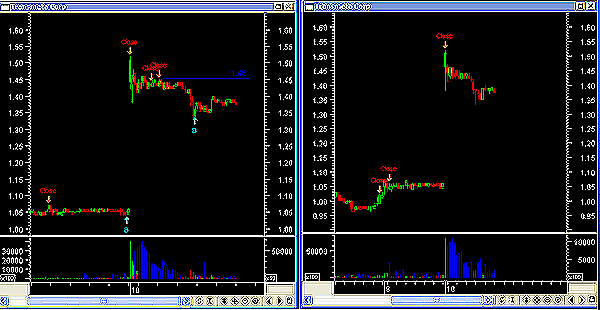
| What now for the stock? To answer this question, I have gone to the intraday charts (Figure 2). |

|
| Figure 2: Transmeta ntraday, five-minute (left) and 15-minute (right) charts |
| Graphic provided by: MetaStock. |
| |
| The first chart is a five-minute chart of TMTA, and shows a buy "B" at 12:55 pm on August 8 at $1.05. Two days later, on August 10, the share opened on a gap at $1.51. The indicator I used to identify the buy/close signals is the relative strength index (RSI) Bollinger bands applied via expert analysis. The formula is listed below: |

|
| |
| The second chart in Figure 2 is a 15-minute chart. The chart did not show a buy signal, but did give a close signal at 6:45 am on August 10. |
| The strategy I use for trading is as follows. If the five-minute chart gives a buy signal and the 15-minute chart has not given a sell signal, I will then buy the stock, so I would have bought Transmeta on August 9. If the five-minute chart gives a sell signal, I will sell the stock. Confirmation by the 15-minute chart could suggest taking a short position, but in this instance, I did not short; I was happy with my profits. Finally, at 9:58 am when the price was $1.38 I received a buy signal. There was no sell signal on the 15-minute chart, so I bought the stock. Note how the volume rose with a rise in the share price, but fell as the price moved sideways. This is bullish. Finally, I will watch the price closely over the last 30 minutes of trading. I have found that should the share price start rising, possibly as short sales are covered, I will place a good till canceled (GTC) sell order and allow it to trade after-hours, at the resistance level of $1.45. I have learned that more often than not, the last half-hour's trading carries over into the first half hour of the following day, so should the share price rise in the last half hour, the share price should continue to rise in the first half hour tomorrow. Note that after hours the number of bids tend to dry up, so more often than not, bids at higher prices have the chance at being filled. |
Has been a technical analyst since 1969, and has worked as a futures and options trader with First Financial Futures in Johannesburg, South Africa.
| Address: | 3256 West 24th Ave |
| Vancouver, BC | |
| Phone # for sales: | 6042634214 |
| E-mail address: | petroosp@gmail.com |
Click here for more information about our publications!
Comments
Date: 08/16/05Rank: 4Comment:

Request Information From Our Sponsors
- VectorVest, Inc.
- Executive Premier Workshop
- One-Day Options Course
- OptionsPro
- Retirement Income Workshop
- Sure-Fire Trading Systems (VectorVest, Inc.)
- Trading as a Business Workshop
- VectorVest 7 EOD
- VectorVest 7 RealTime/IntraDay
- VectorVest AutoTester
- VectorVest Educational Services
- VectorVest OnLine
- VectorVest Options Analyzer
- VectorVest ProGraphics v6.0
- VectorVest ProTrader 7
- VectorVest RealTime Derby Tool
- VectorVest Simulator
- VectorVest Variator
- VectorVest Watchdog
- StockCharts.com, Inc.
- Candle Patterns
- Candlestick Charting Explained
- Intermarket Technical Analysis
- John Murphy on Chart Analysis
- John Murphy's Chart Pattern Recognition
- John Murphy's Market Message
- MurphyExplainsMarketAnalysis-Intermarket Analysis
- MurphyExplainsMarketAnalysis-Visual Analysis
- StockCharts.com
- Technical Analysis of the Financial Markets
- The Visual Investor
