HOT TOPICS LIST
- MACD
- Fibonacci
- RSI
- Gann
- ADXR
- Stochastics
- Volume
- Triangles
- Futures
- Cycles
- Volatility
- ZIGZAG
- MESA
- Retracement
- Aroon
INDICATORS LIST
LIST OF TOPICS
PRINT THIS ARTICLE
by Arthur Hill
The Nikkei 225 has stalled over the last 18 months, but some potentially bullish patterns could yield a breakout soon.
Position: Accumulate
Arthur Hill
Arthur Hill is currently editor of TDTrader.com, a website specializing in trading strategies, sector/industry specific breadth stats and overall technical analysis. He passed the Society of Technical Analysts (STA London) diploma exam with distinction is a Certified Financial Technician (CFTe). Prior to TD Trader, he was the Chief Technical Analyst for Stockcharts.com and the main contributor to the ChartSchool.
PRINT THIS ARTICLE
CUP WITH HANDLE
Nikkei And The Cup-With-Handle
08/10/05 08:20:25 AMby Arthur Hill
The Nikkei 225 has stalled over the last 18 months, but some potentially bullish patterns could yield a breakout soon.
Position: Accumulate
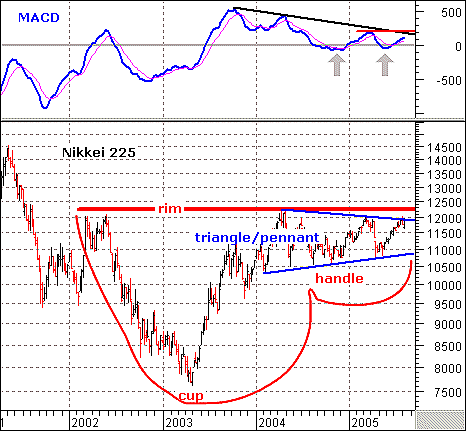
| The first pattern is a large cup-with-handle that extends all the way back to March 2002 (Figure 1). The cup formed from March 2002 to April 2004, the handle from April 2004 to August 2005 and the rim marks resistance at 12,200. A break above 12,200 would confirm this bullish pattern and open the door to higher prices over the next several months. |

|
| Figure 1: Patterns of the Nikkei |
| Graphic provided by: MetaStock. |
| Graphic provided by: Reuters Data. |
| |
| The second pattern looks like a triangle or pennant. Pennants are usually short-term continuation patterns, but the overall structure of this advance and consolidation fits the pennant pattern. The sharp advance (7,603 to 12,190) created an overbought condition and the pennant/triangle worked this off. Now we are waiting for a signal. A move above the upper trendline would be positive and further strength above the 2004 high would be very bullish. Conversely, a move below the lower trendline and 2005 low would be bearish. |
| The movement of moving average convergence/divergence (MACD) also reflects a consolidation. The indicator surged above 500 in October 2003 and then started working its way lower during the next 20 months. The consolidation represents a slowing in momentum, and MACD appropriately reverted toward the zero line. Momentum has yet to turn seriously negative as MACD bounced after each dip below zero (gray arrows). The black trendline shows lower highs, and that momentum (MACD) is trending lower. A move above this trendline and the 2005 high would forge a MACD breakout, and this could be used to confirm a breakout in the Nikkei. |
Arthur Hill is currently editor of TDTrader.com, a website specializing in trading strategies, sector/industry specific breadth stats and overall technical analysis. He passed the Society of Technical Analysts (STA London) diploma exam with distinction is a Certified Financial Technician (CFTe). Prior to TD Trader, he was the Chief Technical Analyst for Stockcharts.com and the main contributor to the ChartSchool.
| Title: | Editor |
| Company: | TDTrader.com |
| Address: | Willem Geetsstraat 17 |
| Mechelen, B2800 | |
| Phone # for sales: | 3215345465 |
| Website: | www.tdtrader.com |
| E-mail address: | arthurh@tdtrader.com |
Traders' Resource Links | |
| TDTrader.com has not added any product or service information to TRADERS' RESOURCE. | |
Click here for more information about our publications!
Comments
Date: 08/11/05Rank: 5Comment:
Date: 08/13/05Rank: 5Comment:

Request Information From Our Sponsors
- StockCharts.com, Inc.
- Candle Patterns
- Candlestick Charting Explained
- Intermarket Technical Analysis
- John Murphy on Chart Analysis
- John Murphy's Chart Pattern Recognition
- John Murphy's Market Message
- MurphyExplainsMarketAnalysis-Intermarket Analysis
- MurphyExplainsMarketAnalysis-Visual Analysis
- StockCharts.com
- Technical Analysis of the Financial Markets
- The Visual Investor
- VectorVest, Inc.
- Executive Premier Workshop
- One-Day Options Course
- OptionsPro
- Retirement Income Workshop
- Sure-Fire Trading Systems (VectorVest, Inc.)
- Trading as a Business Workshop
- VectorVest 7 EOD
- VectorVest 7 RealTime/IntraDay
- VectorVest AutoTester
- VectorVest Educational Services
- VectorVest OnLine
- VectorVest Options Analyzer
- VectorVest ProGraphics v6.0
- VectorVest ProTrader 7
- VectorVest RealTime Derby Tool
- VectorVest Simulator
- VectorVest Variator
- VectorVest Watchdog
