HOT TOPICS LIST
- MACD
- Fibonacci
- RSI
- Gann
- ADXR
- Stochastics
- Volume
- Triangles
- Futures
- Cycles
- Volatility
- ZIGZAG
- MESA
- Retracement
- Aroon
INDICATORS LIST
LIST OF TOPICS
PRINT THIS ARTICLE
by David Penn
Dipping lower in response to a negative stochastic divergence, the S&P 500 finds support at old highs and old trend channels.
Position: N/A
David Penn
Technical Writer for Technical Analysis of STOCKS & COMMODITIES magazine, Working-Money.com, and Traders.com Advantage.
PRINT THIS ARTICLE
SUPPORT & RESISTANCE
The S&P 500's Kick Save At Support
08/10/05 08:54:30 AMby David Penn
Dipping lower in response to a negative stochastic divergence, the S&P 500 finds support at old highs and old trend channels.
Position: N/A
Writing an instructional piece for Inside Lacrosse, an anonymous author observes:
|
| Aside from reminding us that lacrosse is the greatest team sport in the world, this excerpt does a great job of describing what bulls in the Standard & Poor's 500 are trying to do in the wake of the correction that has appeared in the markets in early August (Figure 1). |

|
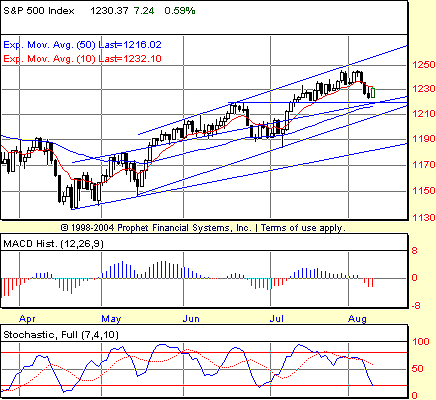
| Figure 1: The correction in early August finds support at the level of the June highs, as well as on the upper boundary of the old trend channel from the spring, and the 50-day exponential moving average. |
| Graphic provided by: Prophet Financial, Inc. |
| |
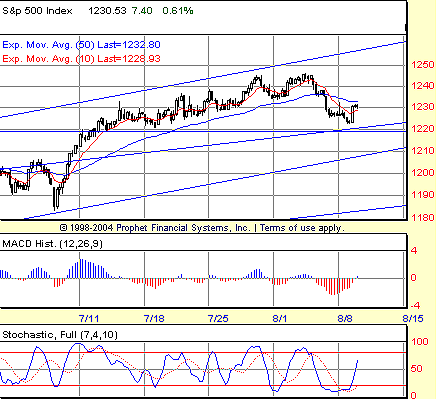
| This correction came at the end of a rally that began with the broad-based market rebound from the terrorist bombings in London in early July. That rally saw the S&P 500 climb from the 1190 area to the 1240 area in about 30 days. While some have pointed out that the rally is relatively typical in terms of breadth and strength, the fact that it came as it appeared that the market's might have topped out in June probably explains much of the amazement that has attended this end of the summer rally. The high in late July is what I call a "true top," by which I mean little more than the fact that the top is confirmed by a negative stochastic divergence. This confirmation is all the more compelling if there is a negative divergence with the moving average convergence/divergence (MACD) histogram as well. But the stochastic provides, for me, a more consistently accurate signal than does the MACDH, and suggested here that a correction of some magnitude was due. Compare the current true top to the one in mid-June (Figure 2). The negative stochastic divergence is clear, and while the correction that followed did not mean the end of the rally, the divergence itself provided a great signal for those profitable longs to take profits, and for new bulls to climb on board. |

|
| Figure 2: Note the positive stochastic divergence in this 90-minute chart of the S&P 500. Support from the June highs and the upper boundary of the April-to-present trend channel looms below at the 1220 level. |
| Graphic provided by: Prophet Financial, Inc. |
| |
| I expect little less from the current negative divergence. So far, the divergence has been enough to trigger sell signals for a number of market timers. But there is some turbulence in the way of support levels, which might interrupt--or at least delay--the gains bears have been desperate for since the last great decline from March to late April. These support levels are numerous enough that those who believe the correction has more room to run would be advised to take note. While support is only support after it has proven to be so, those overeager for the downside might spare themselves some grief by watching to see how the S&P 500 does at current levels. |
| What are these current levels? Foremost is the June high. Previous highs often become potential support once breached, and the June high here is no exception. Further potential support might exist in the form of the old trend channel that extends all the way back to the spring. This trend channel has been abandoned twice during the April-to-present rally, with prices falling back into the channel during the aforementioned late June correction. Currently, the S&P 500 is sitting on the top of the upper boundary of that channel--a boundary that once served as resistance. The last of this potentially tripartite support comes simply enough from the 50-day exponential average, which, at 1216, is a bit below the support provided by the June highs and the old trend channel's upper boundary. But its presence here only underscores the notion that the bears might have a harder time than expected pushing the S&P below these levels. It remains to be seen whether the heroics of those buying stocks after a sharp three-day correction will remain inspired to play the sort of "superior defense" that will have the bulls back on offense before too long. |
Technical Writer for Technical Analysis of STOCKS & COMMODITIES magazine, Working-Money.com, and Traders.com Advantage.
| Title: | Technical Writer |
| Company: | Technical Analysis, Inc. |
| Address: | 4757 California Avenue SW |
| Seattle, WA 98116 | |
| Phone # for sales: | 206 938 0570 |
| Fax: | 206 938 1307 |
| Website: | www.Traders.com |
| E-mail address: | DPenn@traders.com |
Traders' Resource Links | |
| Charting the Stock Market: The Wyckoff Method -- Books | |
| Working-Money.com -- Online Trading Services | |
| Traders.com Advantage -- Online Trading Services | |
| Technical Analysis of Stocks & Commodities -- Publications and Newsletters | |
| Working Money, at Working-Money.com -- Publications and Newsletters | |
| Traders.com Advantage -- Publications and Newsletters | |
| Professional Traders Starter Kit -- Software | |
Click here for more information about our publications!
Comments
Date: 08/11/05Rank: 5Comment:
Date: 08/13/05Rank: 3Comment:

Request Information From Our Sponsors
- StockCharts.com, Inc.
- Candle Patterns
- Candlestick Charting Explained
- Intermarket Technical Analysis
- John Murphy on Chart Analysis
- John Murphy's Chart Pattern Recognition
- John Murphy's Market Message
- MurphyExplainsMarketAnalysis-Intermarket Analysis
- MurphyExplainsMarketAnalysis-Visual Analysis
- StockCharts.com
- Technical Analysis of the Financial Markets
- The Visual Investor
- VectorVest, Inc.
- Executive Premier Workshop
- One-Day Options Course
- OptionsPro
- Retirement Income Workshop
- Sure-Fire Trading Systems (VectorVest, Inc.)
- Trading as a Business Workshop
- VectorVest 7 EOD
- VectorVest 7 RealTime/IntraDay
- VectorVest AutoTester
- VectorVest Educational Services
- VectorVest OnLine
- VectorVest Options Analyzer
- VectorVest ProGraphics v6.0
- VectorVest ProTrader 7
- VectorVest RealTime Derby Tool
- VectorVest Simulator
- VectorVest Variator
- VectorVest Watchdog
