HOT TOPICS LIST
- MACD
- Fibonacci
- RSI
- Gann
- ADXR
- Stochastics
- Volume
- Triangles
- Futures
- Cycles
- Volatility
- ZIGZAG
- MESA
- Retracement
- Aroon
INDICATORS LIST
LIST OF TOPICS
PRINT THIS ARTICLE
by Arthur Hill
Barrick Gold has been outperforming most gold stocks and recently broke to a new 52-week high on good volume.
Position: Buy
Arthur Hill
Arthur Hill is currently editor of TDTrader.com, a website specializing in trading strategies, sector/industry specific breadth stats and overall technical analysis. He passed the Society of Technical Analysts (STA London) diploma exam with distinction is a Certified Financial Technician (CFTe). Prior to TD Trader, he was the Chief Technical Analyst for Stockcharts.com and the main contributor to the ChartSchool.
PRINT THIS ARTICLE
CHANNEL LINES
Barrick Makes A Big Break
08/09/05 08:26:22 AMby Arthur Hill
Barrick Gold has been outperforming most gold stocks and recently broke to a new 52-week high on good volume.
Position: Buy
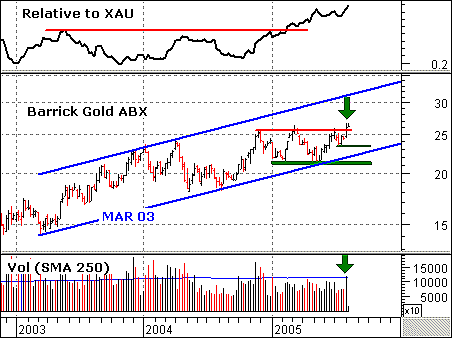
| The top indicator in Figure 1 shows the price relative, which compares the price of Barrick Gold (ABX) and the Philadelphia Gold & Silver Index ($XAU). The price relative rises when ABX outperforms and falls when ABX underperforms. The price relative is clearly rising and ABX is leading the group. The price relative broke resistance way back in February 2005 and moved to another new high in August. |

|
| Figure 1: XAU and ABX. ABX broke consolidation resistance on good volume. |
| Graphic provided by: MetaStock. |
| Graphic provided by: Reuters Data. |
| |
| On the weekly price chart, ABX broke consolidation resistance on good volume. The stock surged above 25 in late 2004 and then traded flat the next 36 weeks (8.37 months). Support at 21 held twice and the stock met resistance just above 25 three times. With a big move last week, the stock broke this resistance barrier on the highest weekly volume since December 2004 (green arrows). Strong volume validates the breakout and argues for further gains. |
| The upside target is around 34 over the next few months. There is a trendline extending up from March 2003 that has been touched three times. This makes it a valid trendline and I drew another trendline parallel. This upper trendline makes for a rising price channel that extends to around 34 by the end of the year. Watch support from the July low (23.5) for signs of a failed breakout and key support at 21 for a trend reversal. |
Arthur Hill is currently editor of TDTrader.com, a website specializing in trading strategies, sector/industry specific breadth stats and overall technical analysis. He passed the Society of Technical Analysts (STA London) diploma exam with distinction is a Certified Financial Technician (CFTe). Prior to TD Trader, he was the Chief Technical Analyst for Stockcharts.com and the main contributor to the ChartSchool.
| Title: | Editor |
| Company: | TDTrader.com |
| Address: | Willem Geetsstraat 17 |
| Mechelen, B2800 | |
| Phone # for sales: | 3215345465 |
| Website: | www.tdtrader.com |
| E-mail address: | arthurh@tdtrader.com |
Traders' Resource Links | |
| TDTrader.com has not added any product or service information to TRADERS' RESOURCE. | |
Click here for more information about our publications!
Comments
Date: 08/09/05Rank: 4Comment:
Date: 08/10/05Rank: 5Comment:

Request Information From Our Sponsors
- StockCharts.com, Inc.
- Candle Patterns
- Candlestick Charting Explained
- Intermarket Technical Analysis
- John Murphy on Chart Analysis
- John Murphy's Chart Pattern Recognition
- John Murphy's Market Message
- MurphyExplainsMarketAnalysis-Intermarket Analysis
- MurphyExplainsMarketAnalysis-Visual Analysis
- StockCharts.com
- Technical Analysis of the Financial Markets
- The Visual Investor
- VectorVest, Inc.
- Executive Premier Workshop
- One-Day Options Course
- OptionsPro
- Retirement Income Workshop
- Sure-Fire Trading Systems (VectorVest, Inc.)
- Trading as a Business Workshop
- VectorVest 7 EOD
- VectorVest 7 RealTime/IntraDay
- VectorVest AutoTester
- VectorVest Educational Services
- VectorVest OnLine
- VectorVest Options Analyzer
- VectorVest ProGraphics v6.0
- VectorVest ProTrader 7
- VectorVest RealTime Derby Tool
- VectorVest Simulator
- VectorVest Variator
- VectorVest Watchdog
