HOT TOPICS LIST
- MACD
- Fibonacci
- RSI
- Gann
- ADXR
- Stochastics
- Volume
- Triangles
- Futures
- Cycles
- Volatility
- ZIGZAG
- MESA
- Retracement
- Aroon
INDICATORS LIST
LIST OF TOPICS
PRINT THIS ARTICLE
by David Penn
Has crude oil entered a pain-free zone for black gold bulls?
Position: N/A
David Penn
Technical Writer for Technical Analysis of STOCKS & COMMODITIES magazine, Working-Money.com, and Traders.com Advantage.
PRINT THIS ARTICLE
ELLIOTT WAVE
A King-Sized Wave Count For Crude
08/09/05 08:20:37 AMby David Penn
Has crude oil entered a pain-free zone for black gold bulls?
Position: N/A
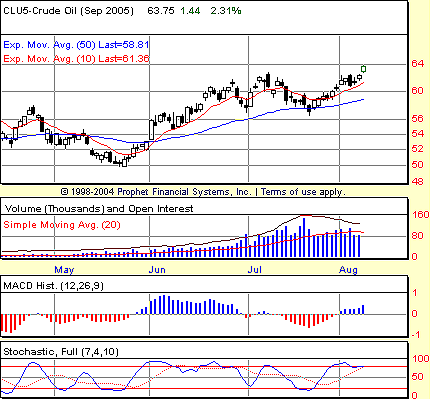
| I recently suggested that negative divergences in the rally in crude oil were suggesting that the world's most dangerous commodity might be headed lower in the immediate term ("Crude Comes In," Traders.com Advantage; July 29, 2005). The two technical tells were a running negative stochastic divergence that extended back to early June, and a growing bearishness displayed by the negative moving average convergence/divergence (MACD) histogram that developed in mid-July. |
| Fine enough technical signals to be true. But apparently neither they nor I got the memo that crude oil doesn't go down. |

|
| Figure 1: Divergences and the MACD histogram both said "down." But September crude would have none of it, as the commodity leapt to new highs in August. |
| Graphic provided by: Prophet Financial, Inc. |
| |
| The running negative stochastic divergence did produce negative action in the form of the mid-July decline. But it is surprising to see a six-week negative divergence create such a relatively mild correction. This suggests powerful underlying strength, such as is found in a strong cyclical or even secular bull market, that will be hard to dent until the advance is truly done. As such, I've looked at long-term price charts for crude oil in order to see just what the bullish thesis on crude oil looks like. Unfortunately, I can't reproduce the oldest of the charts I've consulted (a continuous futures chart starting in the 1920s). But those interested should check out the free historical price charts available at http://www.sharelynx.com, which are invaluable for this kind of work. I'll tell this thesis in the technical language of Elliott wave theory. It appears as if crude oil made a secular bottom in the mid-1940s. An initial wave (I) then takes place in the move upward in crude oil from the mid-1940s to about 1950. Crude oil prices then moved largely sideways from the late 1940s to the early 1970s in a wave (II). The oil shocks of the 1970s, per this thesis, were a large part of the wave (III) rally in crude oil. Given what we know about third waves (per AJ Frost and Robert Prechter: "Third waves are wonders to behold. They are strong and broad, and the trend as this point is unmistakable"), it might be a good idea to refresh what Elliott wave theory has to say about commodity price movement as opposed to stock price movement. Again, per Frost and Prechter:
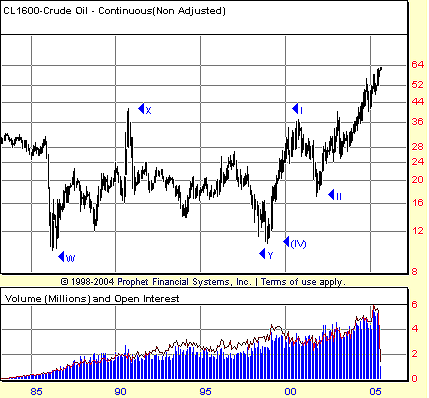
I think this is significantly applicable to third waves as well. When wave (III) topped out in the early 1980s, crude oil went into an extended bear market. It is not coincidental that this bear market in crude oil, which lasted for almost two decades, occurred simultaneously with the secular bull market in equities in the 1980s and 1990s. The form of the wave (IV) bear market in crude appears to have been a double three, with significant W and Y lows in 1986 and 1999, respectively, and a significant X high in 1991. |

|
| Figure 2: The double three correction in crude oil (labeled W-X-Y) carved out a wave (IV) secular bear market over the 1980s and 1990s. But since 1999, it appears as if a powerful wave (V) secular bull market may have begun. |
| Graphic provided by: Prophet Financial, Inc. |
| |
| It appears as if wave (IV) ended in 1999, which means that the advance in crude oil we are experiencing is part of a final wave (V) advance that will likely take prices higher than we can imagine right now (the Goldman Sachs call for $100 crude being perhaps one serious exception). By my count, wave I of (V) lasted from the 1999 low to the high in late 2000. Wave II of (V) lasted from that top in late 2000 to the low late in 2001. |
| By this reckoning, the crude oil market is somewhere in wave III of (V)--and has been since late 2001. In the same way that wave (III) was characterized by the "oil cartel" premium of a politicized (and economically self-aware) OPEC, it seems as if wave III of (V)--and, perhaps ultimately, all of wave (V)--might be characterized by the "terror premium" of oil in the age of Al Qaeda and the US invasion and occupation of Iraq. |
Technical Writer for Technical Analysis of STOCKS & COMMODITIES magazine, Working-Money.com, and Traders.com Advantage.
| Title: | Technical Writer |
| Company: | Technical Analysis, Inc. |
| Address: | 4757 California Avenue SW |
| Seattle, WA 98116 | |
| Phone # for sales: | 206 938 0570 |
| Fax: | 206 938 1307 |
| Website: | www.Traders.com |
| E-mail address: | DPenn@traders.com |
Traders' Resource Links | |
| Charting the Stock Market: The Wyckoff Method -- Books | |
| Working-Money.com -- Online Trading Services | |
| Traders.com Advantage -- Online Trading Services | |
| Technical Analysis of Stocks & Commodities -- Publications and Newsletters | |
| Working Money, at Working-Money.com -- Publications and Newsletters | |
| Traders.com Advantage -- Publications and Newsletters | |
| Professional Traders Starter Kit -- Software | |
Click here for more information about our publications!
Comments
Date: 08/09/05Rank: 2Comment:
Date: 08/10/05Rank: 3Comment:

Request Information From Our Sponsors
- StockCharts.com, Inc.
- Candle Patterns
- Candlestick Charting Explained
- Intermarket Technical Analysis
- John Murphy on Chart Analysis
- John Murphy's Chart Pattern Recognition
- John Murphy's Market Message
- MurphyExplainsMarketAnalysis-Intermarket Analysis
- MurphyExplainsMarketAnalysis-Visual Analysis
- StockCharts.com
- Technical Analysis of the Financial Markets
- The Visual Investor
- VectorVest, Inc.
- Executive Premier Workshop
- One-Day Options Course
- OptionsPro
- Retirement Income Workshop
- Sure-Fire Trading Systems (VectorVest, Inc.)
- Trading as a Business Workshop
- VectorVest 7 EOD
- VectorVest 7 RealTime/IntraDay
- VectorVest AutoTester
- VectorVest Educational Services
- VectorVest OnLine
- VectorVest Options Analyzer
- VectorVest ProGraphics v6.0
- VectorVest ProTrader 7
- VectorVest RealTime Derby Tool
- VectorVest Simulator
- VectorVest Variator
- VectorVest Watchdog
