HOT TOPICS LIST
- MACD
- Fibonacci
- RSI
- Gann
- ADXR
- Stochastics
- Volume
- Triangles
- Futures
- Cycles
- Volatility
- ZIGZAG
- MESA
- Retracement
- Aroon
INDICATORS LIST
LIST OF TOPICS
PRINT THIS ARTICLE
by Paolo Pezzutti
Appointment of a new chief operating officer brings prices into resistance.
Position: N/A
Paolo Pezzutti
Author of the book "Trading the US Markets - A Comprehensive Guide to US Markets for International Traders and Investors" - Harriman House (July 2008)
PRINT THIS ARTICLE
Microsoft: The Worldwide Leader In Software
08/09/05 01:39:03 PMby Paolo Pezzutti
Appointment of a new chief operating officer brings prices into resistance.
Position: N/A
| On August 4, Microsoft announced the appointment of Kevin Turner to the role of chief operating officer. Turner will oversee worldwide sales, marketing services, and Microsoft's internal technology operations. Turner most recently served as president and chief executive officer of Sam's Club, a warehouse club operation with over $37 billion in annual sales, and executive vice president of Wal-Mart Stores Inc., where he was responsible for all operations for Sam's Club locations in the United States. Before that, Turner served as executive vice president and chief information officer for Wal-Mart, a role in which he oversaw all information systems operations for the company worldwide. |

|
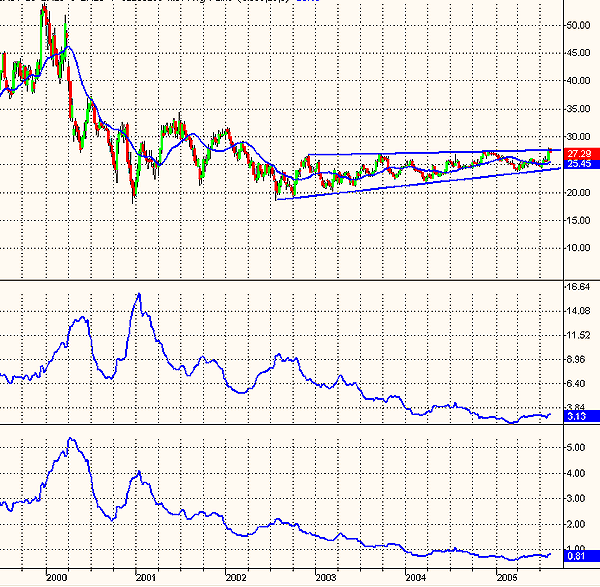
| Figure 1: Weekly Microsoft. Note that speed provides readings of the range as a percentage of the prices (indicator in the upper window). The average true range (lower window) provides readings in points. |
| Graphic provided by: TradeStation. |
| |
| I will base my technical analysis of Microsoft using the average true range (ATR). J. Welles Wilder developed ATR in the 1970s as a measurement of price volatility. He believed that the range was proportional to volatility and that it was indicative of a trend. He then defined the true range, including changes in price that occurred from the previous day's close, rather than starting from the opening price. The true range measures the range of a bar but checks the previous bar's closing price to see if it is outside the current bar's range. When this happens, the closing price is used instead of the high or low. This helps account for gaps between bars. The average true range indicator calculates the average of these values over a certain number of bars. Lower ATRs could indicate a consolidation or a trading range. By the time the ATR begins to rise, meaning the day's trading range is increasing, it means the public is entering the market bringing fresh money. A higher average true range (ATR) is a sign of high volatility and means a stock is trending. Sometimes, the ATR and stock price will display a divergence. It is an important indication, but it has to be confirmed by other indicators and rules. The average true range provides you with a powerful insight of the market personality. You can measure the market players' activity, the market noise, and how easily prices manage to move on a daily basis. The ATR's actual dollar amount is not significant. Higher-priced stocks should have higher true ranges than similar ranges in lower-priced stocks. That is why I prefer to use what I refer to as speed. It is defined as a ratio between the average true range (n) and the average of the last n daily closes. I refer to it as such because it is expressed as a percentage and not as an absolute number. Speed is generally low in bonds (<=1%) and currency markets. It is higher in stock index futures and especially in some commodities. Using speed, you can more easily and correctly: - Compare the different characteristics of assets - Evaluate the structural noise of the market - Assess the asset ability to generate volatility, and - Compare the asset volatility and behavior in different moments in time, regardless of the price they have. As an example of this last property, look at the weekly chart of Microsoft in Figure 1. During the downtrend of 2001, speed, in January, had a peak of 16, meaning that the ratio between the ATR and the average of prices was a staggering 16%! higher than the previous June 2000 peak of 13.55%. This was not highlighted by the ATR, that, instead, printed a divergence with value of $4 in January 2005, against a value of $5 at the peak of June 2000. |

|
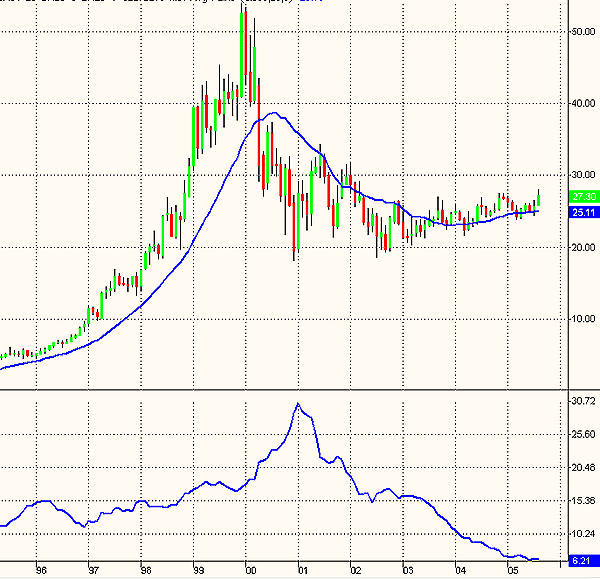
| Figure 2: Monthly Microsoft. The volatility has been going down in the past four years. |
| Graphic provided by: TradeStation. |
| |
| Let's see the technical situation. In the monthly chart (Figure 2), prices moved from the $5 in 1996 to the $54 at the end of 1999! The impressive correction for a stock like Microsoft brought prices down to about $19.5 at the end of 2000. Since then, prices started a sideways movement in the range of $20-30. Note how speed signals the volatility peak at the end of 2000. Since then, the volatility has been going steadily down and now it is at a 10 years' low. At this level, I would expect an expansion in volatility, with a strong trend emerging, although it is quite difficult to say when this is going to happen. These lateral phases can be quite long. |

|
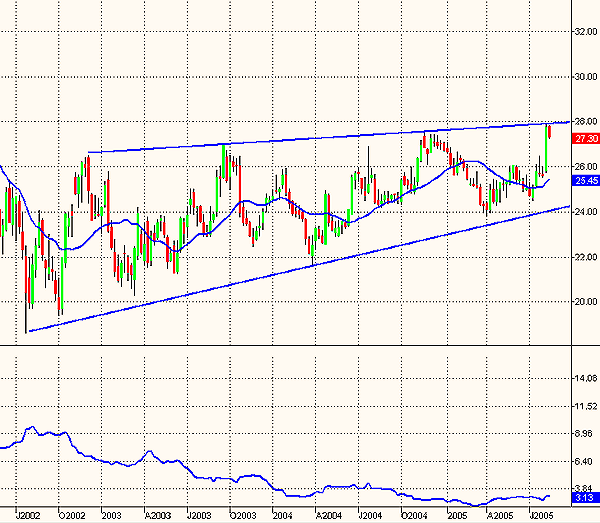
| Figure 3: Weekly Microsoft. Prices are testing the resistance. |
| Graphic provided by: TradeStation. |
| |
| At the weekly level (Figure 3), prices during the past three years moved upward in a positively inclined channel, gaining about 30% from the lows. Volatility has been going down throughout the period. The trendlines that limit the large channel are converging. The last-week bar is an impressive wide-ranging one that brought prices right into resistance. |

|
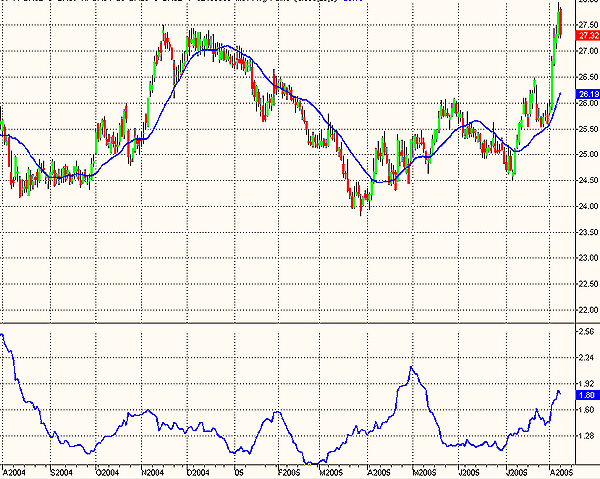
| Figure 4: Daily Microsoft. The Turtle Soup Plus One was successful. Prices retrace after a long leg up into resistance. |
| Graphic provided by: TradeStation. |
| |
| In the daily chart (Figure 4), you can see the big swings that characterized the stock during the past year. The last upleg started a month ago; prices gained $3, more than 10%. The last-week increase in volatility brought prices to test the resistance level of $27.50. The August 5th bar is a setup for the turtle soup plus (see my May 2nd article). The rules for sells: - The previous 20-day high has to be at least three days earlier. The close for the day must be at or above the previous 20-day high. - The entry sell-stop is placed the next day at the earlier 20-day high. Most of the times, the markets tend at least to retrace from these significant levels, which is where you can find a profit opportunity. It is possible that in the short term, from these levels, prices will start a consolidation pattern. In the longer term, however, on the technical side, there are elements that make me believe that the stock is in a good situation to spot low-risk entry points. |
Author of the book "Trading the US Markets - A Comprehensive Guide to US Markets for International Traders and Investors" - Harriman House (July 2008)
| Address: | VIA ROBERTO AGO 26 POSTAL CODE 00166 |
| Rome, ITALY | |
| Phone # for sales: | +393357540708 |
| E-mail address: | pezzutti.paolo@tiscali.it |
Click here for more information about our publications!
Comments
Date: 08/09/05Rank: 3Comment:
Date: 08/11/05Rank: 4Comment:

Request Information From Our Sponsors
- VectorVest, Inc.
- Executive Premier Workshop
- One-Day Options Course
- OptionsPro
- Retirement Income Workshop
- Sure-Fire Trading Systems (VectorVest, Inc.)
- Trading as a Business Workshop
- VectorVest 7 EOD
- VectorVest 7 RealTime/IntraDay
- VectorVest AutoTester
- VectorVest Educational Services
- VectorVest OnLine
- VectorVest Options Analyzer
- VectorVest ProGraphics v6.0
- VectorVest ProTrader 7
- VectorVest RealTime Derby Tool
- VectorVest Simulator
- VectorVest Variator
- VectorVest Watchdog
- StockCharts.com, Inc.
- Candle Patterns
- Candlestick Charting Explained
- Intermarket Technical Analysis
- John Murphy on Chart Analysis
- John Murphy's Chart Pattern Recognition
- John Murphy's Market Message
- MurphyExplainsMarketAnalysis-Intermarket Analysis
- MurphyExplainsMarketAnalysis-Visual Analysis
- StockCharts.com
- Technical Analysis of the Financial Markets
- The Visual Investor
