HOT TOPICS LIST
- MACD
- Fibonacci
- RSI
- Gann
- ADXR
- Stochastics
- Volume
- Triangles
- Futures
- Cycles
- Volatility
- ZIGZAG
- MESA
- Retracement
- Aroon
INDICATORS LIST
LIST OF TOPICS
PRINT THIS ARTICLE
by Gary Grosschadl
Rising wedges try to seduce the bulls with false confidence. Bearish candlestick serves as a warning to alert traders.
Position: Sell
Gary Grosschadl
Independent Canadian equities trader and technical analyst based in Peterborough
Ontario, Canada.
PRINT THIS ARTICLE
WEDGE FORMATIONS
Nasdaq Shooting Star Not A Shining Star
08/08/05 01:38:17 PMby Gary Grosschadl
Rising wedges try to seduce the bulls with false confidence. Bearish candlestick serves as a warning to alert traders.
Position: Sell
| Rising wedges are a bit of a paradox. The trend is rising; however, it is a weak pattern. Momentum weakens and, ideally, so does volume as the wedge matures. This gives the wedge its bearish intent. |
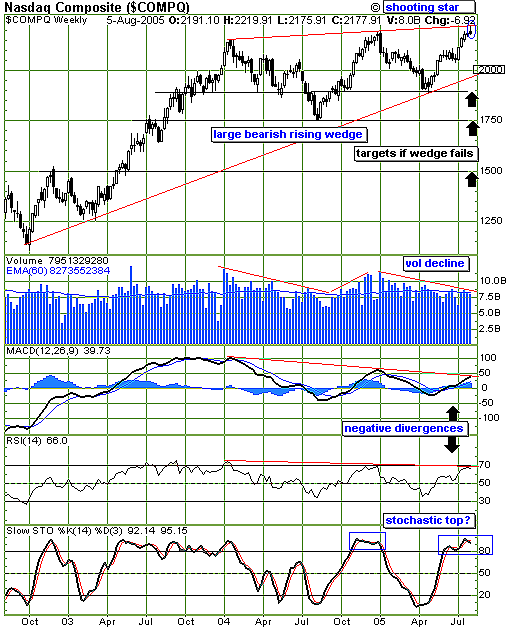
| Figure 1, a weekly chart of the Nasdaq, shows this potentially bearish pattern. I always pay attention to telling candles at the trendlines of these formations, and this one is casting a shadow on this recent upswing. Shooting star candlesticks are often a compelling sign of a top with their tell-tale long upper shadow combined with a small body. The long upper shadow shows how bears are thwarting the bulls against a stronger close. When momentum shifts like this, bulls have second thoughts, and cashing out of recent gains becomes more compelling. |

|
| Figure 1: Nasdaq. Weekly chart hints at downside possibility for the high tech index. |
| Graphic provided by: StockCharts.com. |
| |
| Several indicators illustrate this weakening momentum. Note the weakening volume trend during this latest rise, a bearish sign. Both the MACD (moving average convergence/divergence) and the RSI (relative strength index) show negative divergence in that their path is down while the index has been rising. Finally, the stochastic oscillator is in overbought territory, hinting at the likelihood of a coming downturn, to be confirmed with a move below the 80 level. |
| Should this analysis be correct, downside targets are marked as follows: a test of the lower trendline ~ 2000 and then lower targets of 1900, 1750, and 1500. Failure at the bottom trendline ideally would be met with a surge in volume as traders recognize/fear the rising wedge failure pattern. A surprise move above the recent shooting star candlestick negates this bearish pattern, but I'm not holding my breath. Is one who holds his breath an oxymoron? |
Independent Canadian equities trader and technical analyst based in Peterborough
Ontario, Canada.
| Website: | www.whatsonsale.ca/financial.html |
| E-mail address: | gwg7@sympatico.ca |
Click here for more information about our publications!
Comments
Date: 08/08/05Rank: 5Comment:
Date: 08/09/05Rank: 5Comment:
Date: 08/09/05Rank: 5Comment:
Date: 08/14/05Rank: 5Comment:

Request Information From Our Sponsors
- VectorVest, Inc.
- Executive Premier Workshop
- One-Day Options Course
- OptionsPro
- Retirement Income Workshop
- Sure-Fire Trading Systems (VectorVest, Inc.)
- Trading as a Business Workshop
- VectorVest 7 EOD
- VectorVest 7 RealTime/IntraDay
- VectorVest AutoTester
- VectorVest Educational Services
- VectorVest OnLine
- VectorVest Options Analyzer
- VectorVest ProGraphics v6.0
- VectorVest ProTrader 7
- VectorVest RealTime Derby Tool
- VectorVest Simulator
- VectorVest Variator
- VectorVest Watchdog
- StockCharts.com, Inc.
- Candle Patterns
- Candlestick Charting Explained
- Intermarket Technical Analysis
- John Murphy on Chart Analysis
- John Murphy's Chart Pattern Recognition
- John Murphy's Market Message
- MurphyExplainsMarketAnalysis-Intermarket Analysis
- MurphyExplainsMarketAnalysis-Visual Analysis
- StockCharts.com
- Technical Analysis of the Financial Markets
- The Visual Investor
