HOT TOPICS LIST
- MACD
- Fibonacci
- RSI
- Gann
- ADXR
- Stochastics
- Volume
- Triangles
- Futures
- Cycles
- Volatility
- ZIGZAG
- MESA
- Retracement
- Aroon
INDICATORS LIST
LIST OF TOPICS
PRINT THIS ARTICLE
by Paolo Pezzutti
Recent news of the Adidas-Reebok deal has had a sharp impact on investors' attitude about Nike.
Position: N/A
Paolo Pezzutti
Author of the book "Trading the US Markets - A Comprehensive Guide to US Markets for International Traders and Investors" - Harriman House (July 2008)
PRINT THIS ARTICLE
Nike: Successful Company, Positive Outlook
08/05/05 02:57:21 PMby Paolo Pezzutti
Recent news of the Adidas-Reebok deal has had a sharp impact on investors' attitude about Nike.
Position: N/A
| Nike's principal products are sports and fitness footwear, apparel and equipment. The company mainly markets athletic footwear and athletic apparel worldwide. The company's products equip athletes in tennis, golf, soccer, baseball, football, bicycling, volleyball, wrestling, and more. The group operates 23 distribution centers in Europe, Asia, Australia, Latin America, Africa, and Canada. The company has a capitalization of about US$23 billion and 25,000 employees. Nike has a return on equity of about 25%, an operating margin of 14%, and a gross margin of 44%. The book value is about $21.5 and the last dividend was $0.856. |
| Now for the news. Adidas paid $59 a share for Reebok, a 34% premium over Reebok's stock market price. It seems that Nike has 36.3% of the US athletic footwear market, and the combination of Reebok and Adidas will have 21.1%. Adidas said the deal would lift earnings in the first year; it sees US$150 million in annual cost savings by the third year. The deal will have to pass muster with antitrust regulators in Europe and the US, however. Adidas said it did not expect significant job cuts. Each brand will retain its identity. Investors in Nike interpreted the news as favorable for the company, sending shares up. For Nike shareholders, efforts to reorganize among the Adidas and Reebok management teams during integration could be beneficial in the short term. The benefits of the deal for Adidas are being questioned by some analysts, given the financial implications. |

|
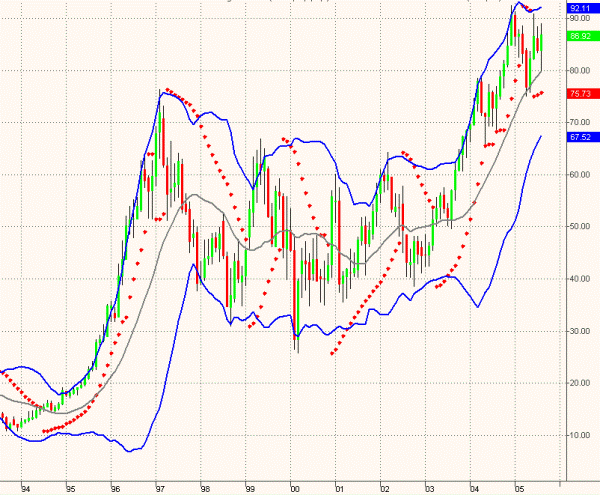
| Figure 1: The Nike monthly chart |
| Graphic provided by: TradeStation. |
| |
To analyze the technical conditions, I will use the Bollinger Bands and the parabolic stop and reverse (SAR) indicator. The TradeStation online help reported about parabolic SAR this way:
In the monthly chart (Figure 1), you can see the performance of the past 10 years, with prices going up from $10 to about $90. Things, however, are not always easy and only a long-term investor would have profited from the move. In fact, prices shot up from $10 to $70 in only three years (between 1994 and 1997) before starting a very long consolidation period that lasted six years! In 2003, prices managed to exit that phase and moved from $50 to $90 in the next two years. The parabolic SAR worked very well during the trending market (1994-97 and 2003-05), but provided false signals in lateral phases, which did not print large volatile swings. That is, in fact, the drawback of this indicator. Prices printed their all-time high on December 31, 2004, at $93.43. Since then, prices started a four-month correction and now are trying to retest the previous high. Currently, the parabolic SAR is long. Bollinger Bands are closing. In particular, the upper band is now almost horizontal and the lower band is converging. The environment is typical of a consolidation phase during an uptrend. |

|
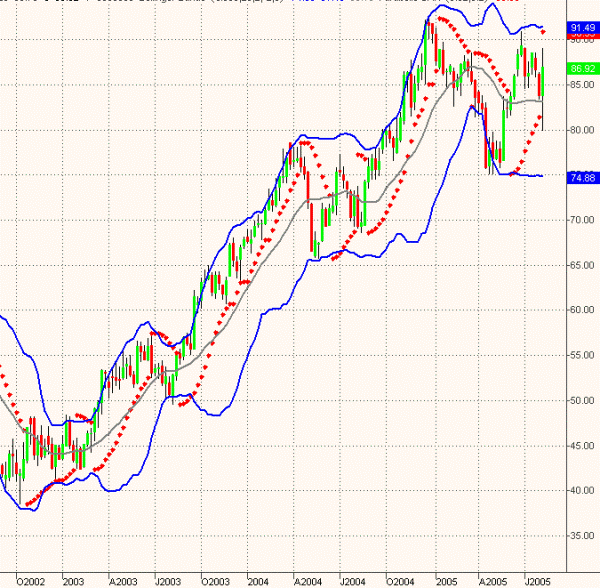
| Figure 2: Nike weekly chart |
| Graphic provided by: TradeStation. |
| |
| At the weekly level (Figure 2), note how well the parabolic SAR followed the legs of the last two years' uptrend. However, during corrections, you would have suffered from losses following. In my opinion, this is a useful indicator, but it needs confirmation from other tools. The Bollinger Bands can help in this regard to select a trend environment from a trading range. After the December 2004 high, prices performed a typical A-B-C correction, finding support at about $75 at the end of last April 2005. Prices moved up to resistance in the $91 area before correcting again with a short A-B-C move. The last week saw an impressive up wide-ranging bar, which is indicating the way to retest previous highs. This is happening in a sideways market phase. You can see it from the Bollinger Bands, that are perfectly flat. The parabolic SAR gave a sell signal, but it would be prudent to follow its indications in this environment. |

|
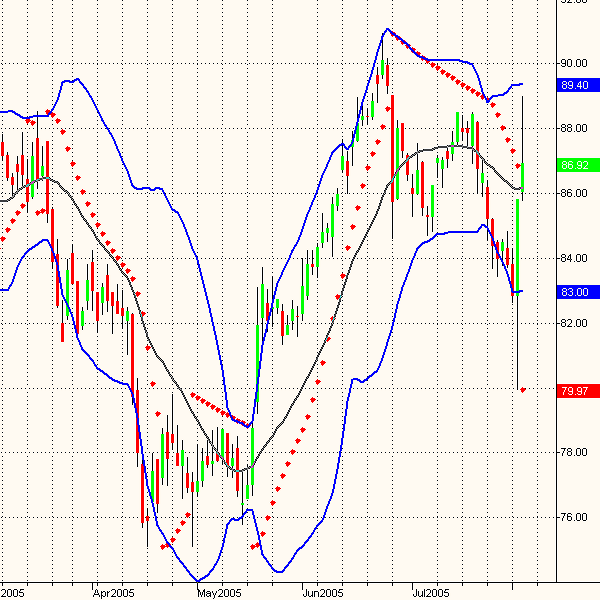
| Figure 3: Nike daily chart. Note the impressive wide-ranging bars of the last two trading sessions. |
| Graphic provided by: TradeStation. |
| |
| The daily chart (Figure 3) is the most interesting. The double low at the end of April 2005 did not manage to tag the lower Bollinger Band. From there, prices started the steep uptrend to the 90.93 high printed on June 23. On this occasion, the parabolic SAR managed to keep in the trend since the beginning. Unfortunately, the exit was signaled on the down wide-ranging bar on June 27! The A-B-C correction brought prices down to about $78. In addition, in this case, the indicator did not manage to provide you with a timely signal to exit the short position: It did so after the extremely volatile session that printed the up wide-ranging bar on August 2! That bar is very important, because it provides the trader with the information that investors reacted emotionally and positively entering the market. The bar is now an important support. During the last volatile trading session, investors tried to continue and ride the Adidas-Reebok deal news. Prices met resistance and closed in the lower half of the range: a short-term weakness signal. The parabolic turned positive. In this phase, the Bollinger Bands cannot print the up impulse. The next consolidation phase could provide an entry point at least to retest previous highs, although the high-volatility environment can increase risks. |
Author of the book "Trading the US Markets - A Comprehensive Guide to US Markets for International Traders and Investors" - Harriman House (July 2008)
| Address: | VIA ROBERTO AGO 26 POSTAL CODE 00166 |
| Rome, ITALY | |
| Phone # for sales: | +393357540708 |
| E-mail address: | pezzutti.paolo@tiscali.it |
Click here for more information about our publications!
Comments
Date: 08/06/05Rank: 3Comment:

Request Information From Our Sponsors
- StockCharts.com, Inc.
- Candle Patterns
- Candlestick Charting Explained
- Intermarket Technical Analysis
- John Murphy on Chart Analysis
- John Murphy's Chart Pattern Recognition
- John Murphy's Market Message
- MurphyExplainsMarketAnalysis-Intermarket Analysis
- MurphyExplainsMarketAnalysis-Visual Analysis
- StockCharts.com
- Technical Analysis of the Financial Markets
- The Visual Investor
- VectorVest, Inc.
- Executive Premier Workshop
- One-Day Options Course
- OptionsPro
- Retirement Income Workshop
- Sure-Fire Trading Systems (VectorVest, Inc.)
- Trading as a Business Workshop
- VectorVest 7 EOD
- VectorVest 7 RealTime/IntraDay
- VectorVest AutoTester
- VectorVest Educational Services
- VectorVest OnLine
- VectorVest Options Analyzer
- VectorVest ProGraphics v6.0
- VectorVest ProTrader 7
- VectorVest RealTime Derby Tool
- VectorVest Simulator
- VectorVest Variator
- VectorVest Watchdog
