HOT TOPICS LIST
- MACD
- Fibonacci
- RSI
- Gann
- ADXR
- Stochastics
- Volume
- Triangles
- Futures
- Cycles
- Volatility
- ZIGZAG
- MESA
- Retracement
- Aroon
INDICATORS LIST
LIST OF TOPICS
PRINT THIS ARTICLE
by David Penn
About the curiously bullish year-long commodity odyssey.
Position: N/A
David Penn
Technical Writer for Technical Analysis of STOCKS & COMMODITIES magazine, Working-Money.com, and Traders.com Advantage.
PRINT THIS ARTICLE
BREAKOUTS
Diamond, Sawtooth, And Rally
08/05/05 09:42:53 AMby David Penn
About the curiously bullish year-long commodity odyssey.
Position: N/A
| The last time I wrote about the CRB index ("Will Commodities Get A Bid?" Traders.com Advantage; April 20, 2005), I was both too early and too late. Too early to catch what turned out to be the bottom of the CRB index's three-month correction, and too late to alert readers to the bullishness of the diamond pattern that--over the course of autumn 2004--set the stage for the push higher in commodities (generally speaking) early in 2005. |
| My apologies. But I do want to revisit both the diamond and the "sawtooth" correction, because they appear to be common patterns that traders and speculators will encounter. |

|
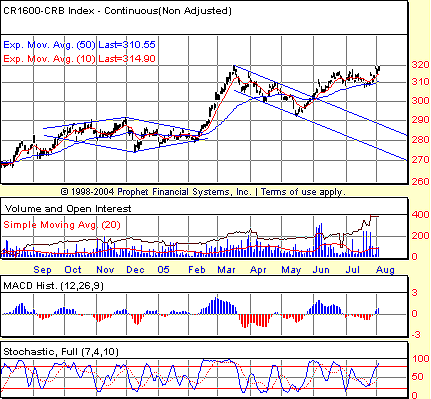
| Figure 1: Note how the sawtooth correction from March to May found support at the same level as the top of the diamond pattern from 2004. |
| Graphic provided by: Prophet Financial, Inc. |
| |
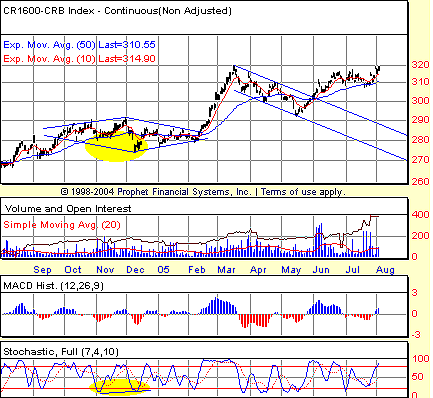
| First, the diamond. I've confessed to being a fool for diamond patterns, and the one that developed in the CRB index from late September 2004 to early February 2005 is a good example of why. The diamond pattern, to refresh, consists of a consolidation that can be bounded by a pair of parallel trendlines, much like a parallelogram or rhombus. As I wrote recently about the diamond pattern in the yen, the tell-tale fingerprint of a diamond pattern for me is the sharp move upward or downward followed by a sharp move of equal (or near equal) amplitude in the opposite direction. This switchback move was evident in the CRB diamond, as shown in Figure 1. First there was the consolidation, a gradually widening range leading up to the initial advance to form the top of the diamond in late November. This was followed immediately afterward by a decline in early December and a subsequent consolidation that featured a gradually tightening or contracting range. Explained this way, a diamond is a symmetrical, expanding triangle on one end, connected to a symmetrical, contracting triangle on the other. And it is from this contraction of both price and volatility that the eventually breakout will emerge. There were also directional clues to be gleaned from the diamond pattern. Note how the diamond makes a low in earliest November and then a markedly lower low in December. At the same time, the stochastic is making a higher high in December relative to November. This represents a positive stochastic divergence, suggesting that the breakout, when it comes, will be upward as opposed to downward. While not foolproof, spotting divergences like these in chart patterns like diamonds can be of tremendous value in getting the earliest, most advantageous entries before prices begin to move in earnest. The glory of the diamond breakout is plain for all to see. The size of the diamond anticipated a breakout move of about 16 points from the level at the break (approximately 284). This suggested a minimum upside to 300, which the CRB index managed to accomplish on the 11th day after the breakout. So let's turn to the sawtooth correction that began with the peak in the CRB in mid-March. |

|
| Figure 2: The positive stochastic divergence was a good sign that the diamond pattern had established a true low in early December. |
| Graphic provided by: Prophet Financial, Inc. |
| |
| Rick Ackerman, trader and publisher of Rick's Picks (http://www.rickackerman.com), wrote what was for me (and many other bears) a cautionary note back in autumn 2004. Ackerman presented a chart of the Standard & Poor's 500, which was then displaying the sort of downwardly cast, sawtooth correction that we see in the March-May correction in Figure 1. Ackerman said that he had looked at countless charts, but couldn't find an instance in which such a sawtooth correction led to a significant decline. This was a major observation given the prevailing bearishness of the summer of 2004, and one that turned out to be prescient as the markets bottomed in August and rallied strongly over the next few months. The sawtooth correction in the CRB in March through May of this year is another example of this sort of market retreat. For all the similarity between the CRB correction and the one in the S&P 500 in 2004, the pattern in 2004 does actually resemble an expanding triangle--or, at least, the Elliott wave version of that pattern. The fact that parallel lines bind the correction in the CRB, rather than diverging ones as would be the case in an expanding triangle, is the key difference between the two. |
| What is amazing about the sawtooth correction here is where it ended: precisely at the 292 level, which aligns with the top of the diamond from 2004. That end, it should be added, was also accompanied by clues such as a positive, month-on-month, moving average convergence/divergence (MACD) histogram divergence, as well as a shorter-term positive stochastic divergence between the early May dip and the sharper decline closer to mid-month. And from that bottom in mid-May, the CRB index launched upon a rally that (so far) is only slightly less impressive than the one that was borne of the diamond pattern only a few months ago. |
Technical Writer for Technical Analysis of STOCKS & COMMODITIES magazine, Working-Money.com, and Traders.com Advantage.
| Title: | Technical Writer |
| Company: | Technical Analysis, Inc. |
| Address: | 4757 California Avenue SW |
| Seattle, WA 98116 | |
| Phone # for sales: | 206 938 0570 |
| Fax: | 206 938 1307 |
| Website: | www.Traders.com |
| E-mail address: | DPenn@traders.com |
Traders' Resource Links | |
| Charting the Stock Market: The Wyckoff Method -- Books | |
| Working-Money.com -- Online Trading Services | |
| Traders.com Advantage -- Online Trading Services | |
| Technical Analysis of Stocks & Commodities -- Publications and Newsletters | |
| Working Money, at Working-Money.com -- Publications and Newsletters | |
| Traders.com Advantage -- Publications and Newsletters | |
| Professional Traders Starter Kit -- Software | |
Click here for more information about our publications!
Comments
Date: 08/06/05Rank: 3Comment:

Request Information From Our Sponsors
- StockCharts.com, Inc.
- Candle Patterns
- Candlestick Charting Explained
- Intermarket Technical Analysis
- John Murphy on Chart Analysis
- John Murphy's Chart Pattern Recognition
- John Murphy's Market Message
- MurphyExplainsMarketAnalysis-Intermarket Analysis
- MurphyExplainsMarketAnalysis-Visual Analysis
- StockCharts.com
- Technical Analysis of the Financial Markets
- The Visual Investor
- VectorVest, Inc.
- Executive Premier Workshop
- One-Day Options Course
- OptionsPro
- Retirement Income Workshop
- Sure-Fire Trading Systems (VectorVest, Inc.)
- Trading as a Business Workshop
- VectorVest 7 EOD
- VectorVest 7 RealTime/IntraDay
- VectorVest AutoTester
- VectorVest Educational Services
- VectorVest OnLine
- VectorVest Options Analyzer
- VectorVest ProGraphics v6.0
- VectorVest ProTrader 7
- VectorVest RealTime Derby Tool
- VectorVest Simulator
- VectorVest Variator
- VectorVest Watchdog
