HOT TOPICS LIST
- MACD
- Fibonacci
- RSI
- Gann
- ADXR
- Stochastics
- Volume
- Triangles
- Futures
- Cycles
- Volatility
- ZIGZAG
- MESA
- Retracement
- Aroon
INDICATORS LIST
LIST OF TOPICS
PRINT THIS ARTICLE
by Koos van der Merwe
MGI Pharma Inc. (MOGN) is an oncology-focused pharmaceutical company that acquires, develops and commercializes proprietary pharmaceutical products. They currently market four cancer-related products in the United States.
Position: Accumulate
Koos van der Merwe
Has been a technical analyst since 1969, and has worked as a futures and options trader with First Financial Futures in Johannesburg, South Africa.
PRINT THIS ARTICLE
MGI Pharma Inc. Showing Life
08/04/05 01:23:40 PMby Koos van der Merwe
MGI Pharma Inc. (MOGN) is an oncology-focused pharmaceutical company that acquires, develops and commercializes proprietary pharmaceutical products. They currently market four cancer-related products in the United States.
Position: Accumulate
| The question is always, "Is it worth investing in a company of hope?" Let's face it, most biotechnology companies spend millions of dollars on research, hoping to cure a targeted disease, produce a viable product, and bring in huge profits to the company. But remember that Viagra, which brought Pfizer billions of dollars, was found by accident. Pfizer marketed a blood pressure pill, and noticed that one of the side affects was... and this led to Viagra. How many other companies can be that lucky? |
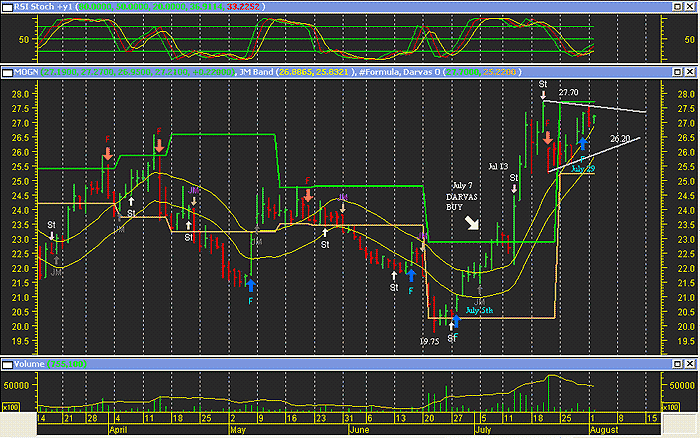
| Well, MGI Pharma Inc. started showing life on June 23rd, 2005 at $20, having fallen from higher levels. Let's examine the chart. |

|
| MGI Pharma. |
| Graphic provided by: MetaStock. |
| |
| To analyze the chart I have programmed my preferred indicators into Metastock Expert Advisor. Now when I open the chart, the triggers are automatically launched. They are: St = RSI stochastic F = Fisher Transform JM = Internal trading band Darvas = the Darvas box trading strategy (Formulas are available via email: jsinger@globalsec.com) |
| I use the triggers as follows. I will buy/sell the stock on the Fisher buy/sell or RSI stochastic buy /sell, depending on which comes first. I will close out the position on a sell or on a stop-loss. I use the JM and Darvas strategies for long-term positions. Note that on July 5th the JM strategy gave a buy and this was confirmed by a Darvas buy on July 7th. A Fisher buy and a RSI stochastic buy were received earlier, but they were closed out on July 14th, the day after the trigger on July 13th, so they closed into a rising price. The chart also shows a consolidation triangle, suggesting a target of $34.15 should the price break out of the triangle from the low of $26.20. (27.70 - 10.75 = 7.95 + 26 20 = 34.15). Of course should the breakout occur at a higher price from a higher low, then the target could be higher. |
| On July 29th the Fisher Transform indicator gave a buy signal, so I would have bought for a short-term trade had I not previously bought the share on the JM or Darvas triggers for the long-term. I would now hold the share until either the target is reached, or a rising stop-loss is triggered. Finally, I have the RSI stochastic indicator on the screen... old habits of looking at indicators rather than triggers die hard. |
Has been a technical analyst since 1969, and has worked as a futures and options trader with First Financial Futures in Johannesburg, South Africa.
| Address: | 3256 West 24th Ave |
| Vancouver, BC | |
| Phone # for sales: | 6042634214 |
| E-mail address: | petroosp@gmail.com |
Click here for more information about our publications!
Comments
Date: 08/04/05Rank: 3Comment:

Request Information From Our Sponsors
- StockCharts.com, Inc.
- Candle Patterns
- Candlestick Charting Explained
- Intermarket Technical Analysis
- John Murphy on Chart Analysis
- John Murphy's Chart Pattern Recognition
- John Murphy's Market Message
- MurphyExplainsMarketAnalysis-Intermarket Analysis
- MurphyExplainsMarketAnalysis-Visual Analysis
- StockCharts.com
- Technical Analysis of the Financial Markets
- The Visual Investor
- VectorVest, Inc.
- Executive Premier Workshop
- One-Day Options Course
- OptionsPro
- Retirement Income Workshop
- Sure-Fire Trading Systems (VectorVest, Inc.)
- Trading as a Business Workshop
- VectorVest 7 EOD
- VectorVest 7 RealTime/IntraDay
- VectorVest AutoTester
- VectorVest Educational Services
- VectorVest OnLine
- VectorVest Options Analyzer
- VectorVest ProGraphics v6.0
- VectorVest ProTrader 7
- VectorVest RealTime Derby Tool
- VectorVest Simulator
- VectorVest Variator
- VectorVest Watchdog
