HOT TOPICS LIST
- MACD
- Fibonacci
- RSI
- Gann
- ADXR
- Stochastics
- Volume
- Triangles
- Futures
- Cycles
- Volatility
- ZIGZAG
- MESA
- Retracement
- Aroon
INDICATORS LIST
LIST OF TOPICS
PRINT THIS ARTICLE
by Arthur Hill
While the Nasdaq moved higher over the last few months, Adobe (ADBE) has languished and formed a large bearish reversal pattern.
Position: Sell
Arthur Hill
Arthur Hill is currently editor of TDTrader.com, a website specializing in trading strategies, sector/industry specific breadth stats and overall technical analysis. He passed the Society of Technical Analysts (STA London) diploma exam with distinction is a Certified Financial Technician (CFTe). Prior to TD Trader, he was the Chief Technical Analyst for Stockcharts.com and the main contributor to the ChartSchool.
PRINT THIS ARTICLE
HEAD & SHOULDERS
Adobe's Massive Head-and-Shoulders
08/04/05 01:21:08 PMby Arthur Hill
While the Nasdaq moved higher over the last few months, Adobe (ADBE) has languished and formed a large bearish reversal pattern.
Position: Sell
| Nasdaq moved to a new high for the year on Tuesday, but ADBE remains well below its 2005 high. You do not need a price relative chart comparing ADBE with Nasdaq to figure out that Adobe is underperforming. The discrepancy is blatant -- a 2004 leader has become a 2005 laggard. |
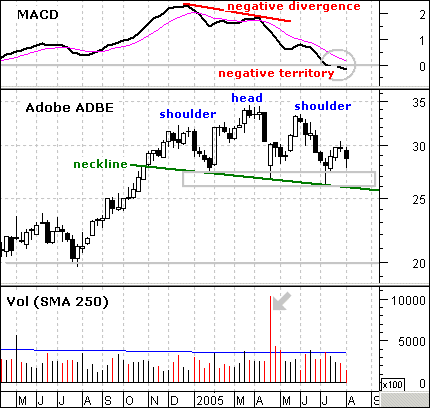
| The price pattern over the last eight months looks like a large head-and-shoulders reversal. The left shoulder formed in Dec-04, the head in Mar-05 and the right shoulder in May-05. The neckline slopes down and marks support between 25 and 26. The downward sloping neckline reflects the lower lows over the last few months and these show increased selling pressure. |

|
| Graphic provided by: MetaStock. |
| Graphic provided by: Reuters Data. |
| |
| I am more inclined to mark support around 26-27. This is confirmed by the last three reaction lows. A move below the low of the support zone would be enough to confirm the head-and-shoulders and target further weakness towards the next support level around 20. |
| Momentum confirms weakness. MACD formed a large negative divergence in April and moved below its signal line in mid-April. The indicator has trended lower for thrree and a half months and recently crossed into negative territory. As long as MACD remains below its signal line, the outlook is for further weakness. A move above the signal line would give ADBE and the head-and-shoulders a reprieve. |
Arthur Hill is currently editor of TDTrader.com, a website specializing in trading strategies, sector/industry specific breadth stats and overall technical analysis. He passed the Society of Technical Analysts (STA London) diploma exam with distinction is a Certified Financial Technician (CFTe). Prior to TD Trader, he was the Chief Technical Analyst for Stockcharts.com and the main contributor to the ChartSchool.
| Title: | Editor |
| Company: | TDTrader.com |
| Address: | Willem Geetsstraat 17 |
| Mechelen, B2800 | |
| Phone # for sales: | 3215345465 |
| Website: | www.tdtrader.com |
| E-mail address: | arthurh@tdtrader.com |
Traders' Resource Links | |
| TDTrader.com has not added any product or service information to TRADERS' RESOURCE. | |
Click here for more information about our publications!
Comments
Date: 08/04/05Rank: 4Comment:
Date: 08/20/05Rank: 5Comment:

Request Information From Our Sponsors
- StockCharts.com, Inc.
- Candle Patterns
- Candlestick Charting Explained
- Intermarket Technical Analysis
- John Murphy on Chart Analysis
- John Murphy's Chart Pattern Recognition
- John Murphy's Market Message
- MurphyExplainsMarketAnalysis-Intermarket Analysis
- MurphyExplainsMarketAnalysis-Visual Analysis
- StockCharts.com
- Technical Analysis of the Financial Markets
- The Visual Investor
- VectorVest, Inc.
- Executive Premier Workshop
- One-Day Options Course
- OptionsPro
- Retirement Income Workshop
- Sure-Fire Trading Systems (VectorVest, Inc.)
- Trading as a Business Workshop
- VectorVest 7 EOD
- VectorVest 7 RealTime/IntraDay
- VectorVest AutoTester
- VectorVest Educational Services
- VectorVest OnLine
- VectorVest Options Analyzer
- VectorVest ProGraphics v6.0
- VectorVest ProTrader 7
- VectorVest RealTime Derby Tool
- VectorVest Simulator
- VectorVest Variator
- VectorVest Watchdog
