HOT TOPICS LIST
- MACD
- Fibonacci
- RSI
- Gann
- ADXR
- Stochastics
- Volume
- Triangles
- Futures
- Cycles
- Volatility
- ZIGZAG
- MESA
- Retracement
- Aroon
INDICATORS LIST
LIST OF TOPICS
PRINT THIS ARTICLE
by Paolo Pezzutti
This volatility-based method makes use of an indicator derived from Bollinger Bands.
Position: N/A
Paolo Pezzutti
Author of the book "Trading the US Markets - A Comprehensive Guide to US Markets for International Traders and Investors" - Harriman House (July 2008)
PRINT THIS ARTICLE
VOLATILITY
John Bollinger: The Squeeze
08/05/05 11:16:24 AMby Paolo Pezzutti
This volatility-based method makes use of an indicator derived from Bollinger Bands.
Position: N/A
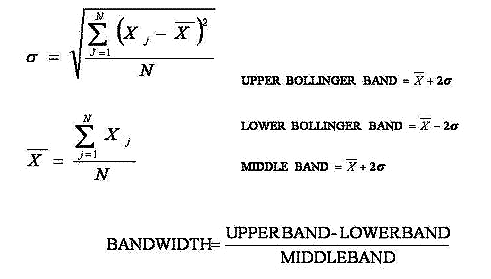
| During an interview in the early 1980s, technician John Bollinger was pressed to put a name on the charting tool he created to measure changes in volatility of financial assets. This is how one of the most famous technical trading tools was born: Bollinger Bands. The bands look at volatility as ever changing rather than static, as was widely believed at the time. They provide a relative definition of high and low. Prices are high at the upper band and low at the lower band. The default elements to build the Bollinger Bands are a 20-day moving average, with two standard deviations plotted off that for the upper and lower Bands. The parameters may be adjusted as necessary. I use Bollinger Bands on daily, weekly, and monthly bases, but also on an intraday basis for scalping trades. See Figure 1. |

|
| |
| BandWidth is an indicator derived from Bollinger Bands. It is a relative measure of the width of the bands. To calculate BandWidth, subtract the lower band from the upper band and normalize the result, dividing by the middle band (Figure 1). The width of the bands is expressed as a percentage of the moving average. This indicator can be used in several ways as described by John Bollinger in his book Bollinger On Bollinger Bands. Using this indicator, you can exploit one of the most powerful setups based on volatility: the Squeeze. It is not the only one, of course. For example, Linda Bradford Raschke and Laurence A. Connors in their book Street Smarts: High Probability Short Term Trading Strategies proposed a setup based on the combination of low historical volatility and Toby Crabel's NR4. Let's see the Squeeze in action. When the bands get very narrow, you can expect a sharp expansion in volatility in the near future. A fall in volatility to extremely low levels suggests a sudden increase in volatility and a sustained trend in the near future. So the Squeeze is triggered when BandWidth falls to its lowest level in the past six months. There is also a more complex definition of the Squeeze as described in John Bollinger's book The Squeeze. Here are some examples. |

|
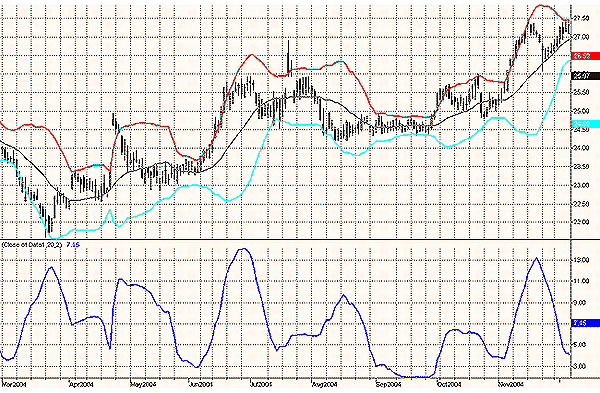
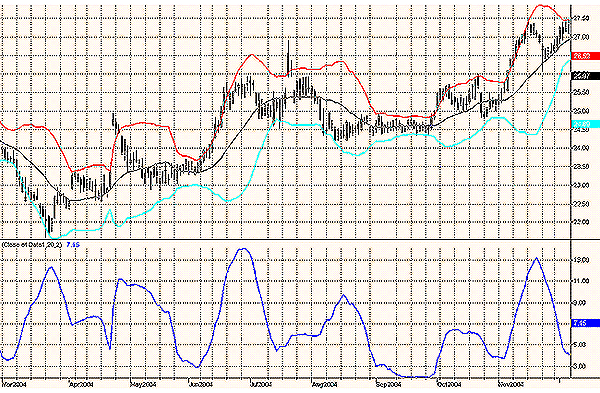
| Figure 2: This Microsoft daily chart printed an interesting setup in September 2004. |
| Graphic provided by: TradeStation. |
| |
| The daily chart of Microsoft (Figure 2) shows a prolonged congestion occurring in September 2004, which brought BandWidth to very low levels. The breakout to the upside was successful, and from there a sustained uptrend was generated. The peak in the subsequent volatility expansion was reached one and a half months later, in November. That signaled the move was over. |

|
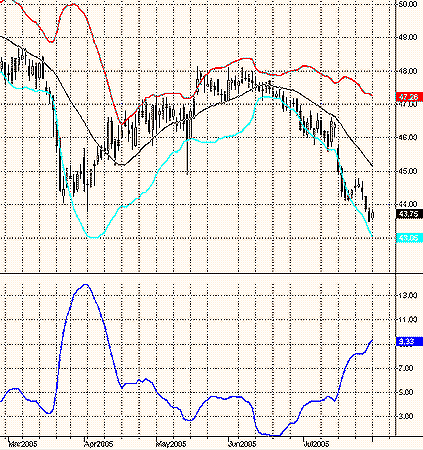
| Figure 3: This Citigroup daily chart displays the increase in volatility following a congested phase. |
| Graphic provided by: TradeStation. |
| |
| In my June 15, 2005, article, I stressed the very long congestion and the associated extremely low values of average directional movement index (ADX) together with narrow Bollinger Bands. This market condition suggests a new trend might emerge. Switching your trading style to "breakout mode," you could enter the market and exploit the high-volatility environment to come. This is developing today on Citigroup's (Figure 3) daily time frame, with the volatility expansion that started on the third week of June still going on in a downtrend. Bollinger Bands are still opening. Note that the upper Band has already terminated its impulse in the opposite direction of the trend and has now turned down. Prices have not managed to tag the lower band so far, however. |

|
| Figure 4: The QQQQ daily chart printed a fake move on the April 2005 setup. |
| Graphic provided by: TradeStation. |
| |
| In Figure 4, you can see the low of BandWidth that formed last April 2005 on the daily chart of QQQQ. The setup worked--in fact, there was a sharp increase in volatility to the downside with what would seem to be a breakaway gap. Actually, it turned out to be a complex fake. The low formed on the second week of April was retested a couple of weeks later, failing to continue the volatility expansion. Prices quickly reversed to the upside, starting an uptrend that brought prices four points higher in less than a month! Once again, these setups are not guaranteed to be correct 100% of the time. It is necessary to use some sort of management to reduce the inevitable losses. |
Author of the book "Trading the US Markets - A Comprehensive Guide to US Markets for International Traders and Investors" - Harriman House (July 2008)
| Address: | VIA ROBERTO AGO 26 POSTAL CODE 00166 |
| Rome, ITALY | |
| Phone # for sales: | +393357540708 |
| E-mail address: | pezzutti.paolo@tiscali.it |
Click here for more information about our publications!
Comments
Date: 08/06/05Rank: 5Comment:
Date: 08/07/05Rank: 5Comment:
Date: 04/04/06Rank: 5Comment:
Date: 05/15/06Rank: 5Comment:
Date: 12/21/22Rank: 5Comment:

|

Request Information From Our Sponsors
- StockCharts.com, Inc.
- Candle Patterns
- Candlestick Charting Explained
- Intermarket Technical Analysis
- John Murphy on Chart Analysis
- John Murphy's Chart Pattern Recognition
- John Murphy's Market Message
- MurphyExplainsMarketAnalysis-Intermarket Analysis
- MurphyExplainsMarketAnalysis-Visual Analysis
- StockCharts.com
- Technical Analysis of the Financial Markets
- The Visual Investor
- VectorVest, Inc.
- Executive Premier Workshop
- One-Day Options Course
- OptionsPro
- Retirement Income Workshop
- Sure-Fire Trading Systems (VectorVest, Inc.)
- Trading as a Business Workshop
- VectorVest 7 EOD
- VectorVest 7 RealTime/IntraDay
- VectorVest AutoTester
- VectorVest Educational Services
- VectorVest OnLine
- VectorVest Options Analyzer
- VectorVest ProGraphics v6.0
- VectorVest ProTrader 7
- VectorVest RealTime Derby Tool
- VectorVest Simulator
- VectorVest Variator
- VectorVest Watchdog
