HOT TOPICS LIST
- MACD
- Fibonacci
- RSI
- Gann
- ADXR
- Stochastics
- Volume
- Triangles
- Futures
- Cycles
- Volatility
- ZIGZAG
- MESA
- Retracement
- Aroon
INDICATORS LIST
LIST OF TOPICS
PRINT THIS ARTICLE
by David Penn
Can speculators anticipate the direction of a likely break from this diamond consolidation pattern?
Position: N/A
David Penn
Technical Writer for Technical Analysis of STOCKS & COMMODITIES magazine, Working-Money.com, and Traders.com Advantage.
PRINT THIS ARTICLE
THE DIAMOND
A(nother) Diamond In The Yen
08/04/05 12:25:42 PMby David Penn
Can speculators anticipate the direction of a likely break from this diamond consolidation pattern?
Position: N/A
| Paolo Pezzutti does a yeoman's job of highlighting the overall technical condition of the yen, or the USDJPY in his recent Traders.com Advantage article, "Forex USD/JPY: The Currencies After China's Revaluation." The revaluation he is referring to is the decision by the Chinese to "unpeg" their currency, the "renminbi" or "yuan," from the dollar and to allow it to float within a narrow band. However modest, some motion on the "yuan peg" had been anticipated (where not demanded) by economic policy makers in the United States, who believe the peg represents an unfair trading advantage in favor of the Chinese economy. |
| But the yuan, not a truly "traded" currency, leads me to speculate on the currency of China's powerful neighbor, Japan. In other words, how will the revaluation of the yuan affect the yen? Pezzutti's article discusses the yen from a variety of technical perspectives and over a number of time frames; it is an excellent discussion of where the yen is now and might be in the future. To this, I would like to add a relatively minor technical observation that hopefully contributes to understanding and, more importantly, successful trading of the yen. |

|
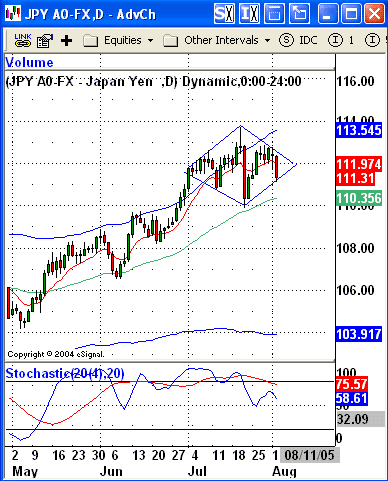
| Figure 1: Even without the negative stochastic divergence, the combination of the shooting star at the top of the rally and the wide-range bar reversal immediately afterward provide bearish portents for traders of USDJPY. |
| Graphic provided by: eSignal. |
| |
| To my eye, the most dominant technical feature on the daily chart of the USDJPY is the diamond consolidation that formed over the course of July. While I tend to be partial toward diamonds the way some technicians are soft on triangles or wedges or breakouts, you won't find many more well-crafted diamonds than the one appearing in Figure 1. For me, the tell-tale diamond signature is the spike up--here in the form of a shooting star, and the sharp reversal--here as the wide-range bar to the downside. A little choppy trading to the left, a little choppy trading to the right and you've got your diamond. |
| The breakout from the diamond occurs when prices penetrate either the upper right or lower right boundary of the pattern. Fake-outs from diamonds are not uncommon; sometimes prices will penetrate either the upper or lower boundary--and may even look to take out the high or the low of the pattern. But if the pattern is truly a diamond, then a false breakout will tend to find resistance (or support) at the top (or bottom) of the pattern, then reverse, and proceed in the true breakout direction. |
| And what of that "true breakout direction"? Are there clues that traders and speculators can divine from the diamond consolidation that might anticipate the direction? The two Japanese candlesticks--a shooting star at the top of a rally and a wide-range bar to the downside--would probably be bearish enough for many. But the presence of a negative stochastic divergence between early July and mid-July suggests that the yen's next big move will be downward rather than upward. |
Technical Writer for Technical Analysis of STOCKS & COMMODITIES magazine, Working-Money.com, and Traders.com Advantage.
| Title: | Technical Writer |
| Company: | Technical Analysis, Inc. |
| Address: | 4757 California Avenue SW |
| Seattle, WA 98116 | |
| Phone # for sales: | 206 938 0570 |
| Fax: | 206 938 1307 |
| Website: | www.Traders.com |
| E-mail address: | DPenn@traders.com |
Traders' Resource Links | |
| Charting the Stock Market: The Wyckoff Method -- Books | |
| Working-Money.com -- Online Trading Services | |
| Traders.com Advantage -- Online Trading Services | |
| Technical Analysis of Stocks & Commodities -- Publications and Newsletters | |
| Working Money, at Working-Money.com -- Publications and Newsletters | |
| Traders.com Advantage -- Publications and Newsletters | |
| Professional Traders Starter Kit -- Software | |
Click here for more information about our publications!
Comments
Date: 08/04/05Rank: 4Comment:
Date: 08/09/05Rank: 5Comment:

Request Information From Our Sponsors
- StockCharts.com, Inc.
- Candle Patterns
- Candlestick Charting Explained
- Intermarket Technical Analysis
- John Murphy on Chart Analysis
- John Murphy's Chart Pattern Recognition
- John Murphy's Market Message
- MurphyExplainsMarketAnalysis-Intermarket Analysis
- MurphyExplainsMarketAnalysis-Visual Analysis
- StockCharts.com
- Technical Analysis of the Financial Markets
- The Visual Investor
- VectorVest, Inc.
- Executive Premier Workshop
- One-Day Options Course
- OptionsPro
- Retirement Income Workshop
- Sure-Fire Trading Systems (VectorVest, Inc.)
- Trading as a Business Workshop
- VectorVest 7 EOD
- VectorVest 7 RealTime/IntraDay
- VectorVest AutoTester
- VectorVest Educational Services
- VectorVest OnLine
- VectorVest Options Analyzer
- VectorVest ProGraphics v6.0
- VectorVest ProTrader 7
- VectorVest RealTime Derby Tool
- VectorVest Simulator
- VectorVest Variator
- VectorVest Watchdog
