HOT TOPICS LIST
- MACD
- Fibonacci
- RSI
- Gann
- ADXR
- Stochastics
- Volume
- Triangles
- Futures
- Cycles
- Volatility
- ZIGZAG
- MESA
- Retracement
- Aroon
INDICATORS LIST
LIST OF TOPICS
PRINT THIS ARTICLE
by Arthur Hill
After consolidating near a support, the iShares 20-year T-Bond Fund (TLT) looks poised to continue lower.
Position: Sell
Arthur Hill
Arthur Hill is currently editor of TDTrader.com, a website specializing in trading strategies, sector/industry specific breadth stats and overall technical analysis. He passed the Society of Technical Analysts (STA London) diploma exam with distinction is a Certified Financial Technician (CFTe). Prior to TD Trader, he was the Chief Technical Analyst for Stockcharts.com and the main contributor to the ChartSchool.
PRINT THIS ARTICLE
DOUBLE TOPS
Bonds Breaking Down
08/01/05 12:12:21 PMby Arthur Hill
After consolidating near a support, the iShares 20-year T-Bond Fund (TLT) looks poised to continue lower.
Position: Sell
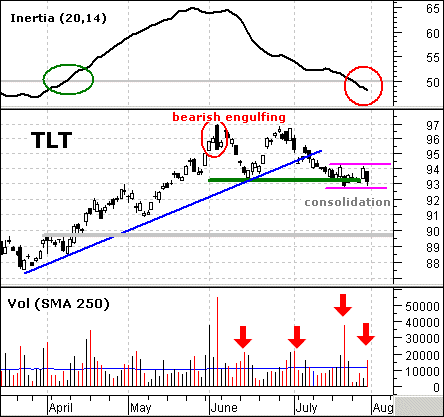
| On the daily chart, the iShares 20-year T-Bond Fund (TLT) formed a top in June and confirmed with a support break in July. The two highs around 97 and low at 93 form a double top. Notice that the first high formed with a large bearish engulfing and second high never managed to exceed this bearish candlestick reversal pattern. |

|
| Graphic provided by: MetaStock. |
| Graphic provided by: Reuters Data. |
| |
| TLT briefly broke support at 93, but managed to quickly firm and consolidate in this area. Consolidations are continuation patterns and the prior decline gives this consolidation a bearish flavor. A move below the consolidation lower would target further weakness towards 90. Should TLT hold firm and break above the consolidation high (94.24), the bulls would gain the upper hand. |
| Volume and the Inertia Indicator favor further weakness. Downside volume since mid June has outpaced upside volume (red arrows). The Inertia Indicator, which is a smoothed version of the relative volatility index, moved below 50 for the first time since early April. Positive inertia is present when the indicator is above 50 and negative inertia rules when the indicator is below 50. With negative inertia and negative volume flows, the odds favor a support break and decline to broken resistance (turned support) around 90. |
Arthur Hill is currently editor of TDTrader.com, a website specializing in trading strategies, sector/industry specific breadth stats and overall technical analysis. He passed the Society of Technical Analysts (STA London) diploma exam with distinction is a Certified Financial Technician (CFTe). Prior to TD Trader, he was the Chief Technical Analyst for Stockcharts.com and the main contributor to the ChartSchool.
| Title: | Editor |
| Company: | TDTrader.com |
| Address: | Willem Geetsstraat 17 |
| Mechelen, B2800 | |
| Phone # for sales: | 3215345465 |
| Website: | www.tdtrader.com |
| E-mail address: | arthurh@tdtrader.com |
Traders' Resource Links | |
| TDTrader.com has not added any product or service information to TRADERS' RESOURCE. | |
Click here for more information about our publications!
Comments
Date: 08/02/05Rank: 4Comment:

|

Request Information From Our Sponsors
- StockCharts.com, Inc.
- Candle Patterns
- Candlestick Charting Explained
- Intermarket Technical Analysis
- John Murphy on Chart Analysis
- John Murphy's Chart Pattern Recognition
- John Murphy's Market Message
- MurphyExplainsMarketAnalysis-Intermarket Analysis
- MurphyExplainsMarketAnalysis-Visual Analysis
- StockCharts.com
- Technical Analysis of the Financial Markets
- The Visual Investor
- VectorVest, Inc.
- Executive Premier Workshop
- One-Day Options Course
- OptionsPro
- Retirement Income Workshop
- Sure-Fire Trading Systems (VectorVest, Inc.)
- Trading as a Business Workshop
- VectorVest 7 EOD
- VectorVest 7 RealTime/IntraDay
- VectorVest AutoTester
- VectorVest Educational Services
- VectorVest OnLine
- VectorVest Options Analyzer
- VectorVest ProGraphics v6.0
- VectorVest ProTrader 7
- VectorVest RealTime Derby Tool
- VectorVest Simulator
- VectorVest Variator
- VectorVest Watchdog
