HOT TOPICS LIST
- MACD
- Fibonacci
- RSI
- Gann
- ADXR
- Stochastics
- Volume
- Triangles
- Futures
- Cycles
- Volatility
- ZIGZAG
- MESA
- Retracement
- Aroon
INDICATORS LIST
LIST OF TOPICS
PRINT THIS ARTICLE
by Paolo Pezzutti
Here's an interesting way to exploit Bollinger Bands.
Position: N/A
Paolo Pezzutti
Author of the book "Trading the US Markets - A Comprehensive Guide to US Markets for International Traders and Investors" - Harriman House (July 2008)
PRINT THIS ARTICLE
BOLLINGER BANDS
Joe Ross And Bollinger Bands
08/01/05 02:21:24 PMby Paolo Pezzutti
Here's an interesting way to exploit Bollinger Bands.
Position: N/A
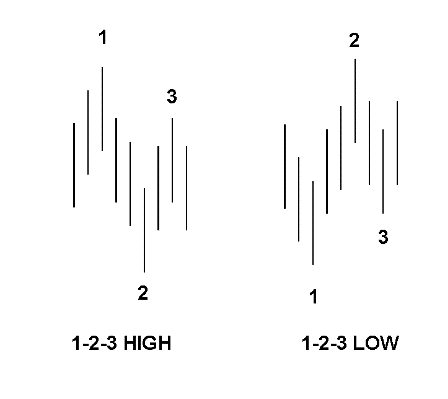
| In his book Electronic Trading TNT IV Tips Tricks and Other Trading Stuff Joe Ross proposes a trading system using Bollinger Bands to generate buy and sell signals. Bollinger Bands were created back in the 80s as a way to produce adaptive trading bands that assumed volatility was dynamic, not static, as was widely believed at the time. Thus, they could aid in pattern recognition and were useful when comparing price action to indicators. Normally Bollinger Bands use a 20-day simple moving average, plotting the Bands two standard deviations above and below the average. Statistically, two standard deviations should contain about 95% of the price action. John Bollinger in his book Bollinger on Bollinger Bands, a bible for those who like this tool, reported that the actual tested value on several markets is about 89%. That means that markets do not follow a normal distribution of prices. But this has already been demonstrated by several authors. Bollinger Bands, however, are a powerful tool for finding turning points and an excellent indicator of relative overbought and oversold conditions. Just because prices approach one of the bands doesn't mean that it's time to buy or sell. Confirmation has to come from other indicators or rules. Joe Ross identified the 1-2-3 Formation and paired it with Bollinger Bands. Briefly, a 1-2-3 high forms at the end of an uptrending market. Prices make a final top (Point 1), move downward to Point 2, where the upward correction starts. The move then continues upward to Point 3, where they pivot and resume a downward movement. You can have more than one bar moving from Point 1 to Point 2, and again from Point 2 to Point 3. A Point 1 high is created when a previous upmove ends and prices begin to move down. The 2 and 3 Points of a 1-2-3 high are created when a correction takes place. When it takes more than three bars to form a higher high/low you are in a congestion (see my May 9, 2005 article about congestion). The opposite is true for a 1-2-3 low formation. Figure 1 shows typical 1-2-3 formations. For more information, read Joe Ross' publications as these concepts cannot be easily summarized in a few lines. This type of trading works well in a trending environment or a volatile trading range. When the volatility is low and the Bollinger Bands become flat, it is probably better to use another method for your trading. Let's review the rules: in an uptrend, prices must touch or exceed the lower Bollinger Band or the moving average before a 1-2-3 formation is in the conditions to be traded. In a downtrend, the opposite is true. The entry point is the breakout at Point 2. If the 1-2-3 formation is generated at the moving average, you can have the confidence to anticipate the breakout of Point 2. In this case, at the breakout you can already cover your costs, just in case it is a false signal. The exit point normally is the high/low of Point 3. Let's study a few examples now. |

|
| |
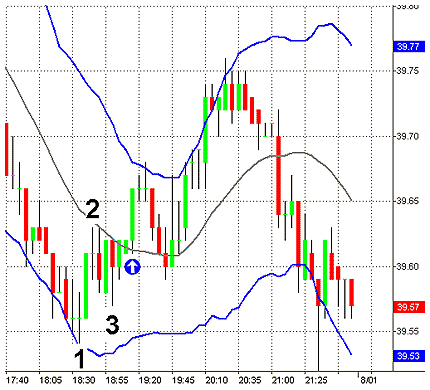
| Figure 2 shows a 1-2-3 low formation generated at the lower Bollinger Band. The breakout at Point 2 at 19:15 would be the buy signal. If you place your stop below Point 3 initially and trail it up, you would exploit the uptrend nicely. I would exit the trade at 20:50. |

|
| Figure 2: 1-2-3 low on QQQQ 5-minute intraday chart. |
| Graphic provided by: TradeStation. |
| |
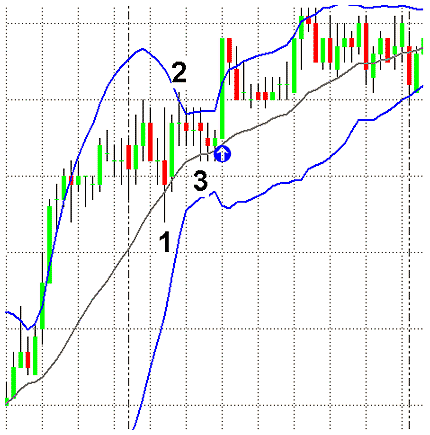
| The 1-2-3 formation in Figure 3 is generated at the moving average. You could enter the trade at the Point 2 breakout or you could anticipate wait based on your anticipation of where prices will go. Typically, in this scenario, you would enter after prices pull back since they tend to advance and then enter a congestion. I would close the position when this happens. |

|
| Figure 3: A 1-2-3 low generated at the moving average. |
| Graphic provided by: TradeStation. |
| |
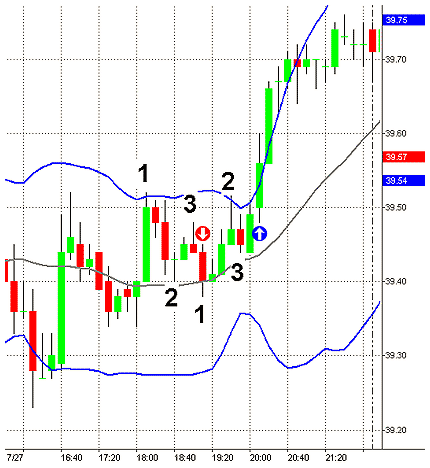
| In Figure 4, the QQQQ's 10-minute intraday chart displays two interesting formations. The first is a 1-2-3 high generated at the upper Bollinger Band. This trade would not be a profitable one since you would be stopped out at the Point 3 breakout. The second one is a 1-2-3 low at the moving average and would provide nice profits if you applied trailing stops. You could enter your trade either at the breakout of Point 2 or prior to it. You can trail your stop using natural supports and attempt to take profits when prices reach the Bollinger Band or at a reversal bar at the Band. |

|
| Figure 4: 1-2-3 formations on the QQQQ 10-minute intraday chart. |
| Graphic provided by: TradeStation. |
| |
| This is by no means a mechanical system. You have to evaluate whether the correct market conditions exist to apply this trading style. It is also not easy to spot the 1-2-3 formations while they develop in real time and, for this, you have to be well-trained. You have to clearly establish stops and you have to define and apply trade management rules. At the end of the day, they make the difference between success and failure. Joe Ross in his books dedicates a lot of pages to these issues. This trading style can help you better understand markets and how to profit from them. It is another tool in your short-term patterns and techniques library. |
Author of the book "Trading the US Markets - A Comprehensive Guide to US Markets for International Traders and Investors" - Harriman House (July 2008)
| Address: | VIA ROBERTO AGO 26 POSTAL CODE 00166 |
| Rome, ITALY | |
| Phone # for sales: | +393357540708 |
| E-mail address: | pezzutti.paolo@tiscali.it |
Click here for more information about our publications!
Comments
Date: 08/02/05Rank: 3Comment:
Date: 08/02/05Rank: 3Comment:
Date: 08/03/05Rank: 4Comment:
Date: 08/09/05Rank: 5Comment:
Date: 08/14/05Rank: 4Comment:
Date: 04/04/06Rank: 5Comment:

Request Information From Our Sponsors
- StockCharts.com, Inc.
- Candle Patterns
- Candlestick Charting Explained
- Intermarket Technical Analysis
- John Murphy on Chart Analysis
- John Murphy's Chart Pattern Recognition
- John Murphy's Market Message
- MurphyExplainsMarketAnalysis-Intermarket Analysis
- MurphyExplainsMarketAnalysis-Visual Analysis
- StockCharts.com
- Technical Analysis of the Financial Markets
- The Visual Investor
- VectorVest, Inc.
- Executive Premier Workshop
- One-Day Options Course
- OptionsPro
- Retirement Income Workshop
- Sure-Fire Trading Systems (VectorVest, Inc.)
- Trading as a Business Workshop
- VectorVest 7 EOD
- VectorVest 7 RealTime/IntraDay
- VectorVest AutoTester
- VectorVest Educational Services
- VectorVest OnLine
- VectorVest Options Analyzer
- VectorVest ProGraphics v6.0
- VectorVest ProTrader 7
- VectorVest RealTime Derby Tool
- VectorVest Simulator
- VectorVest Variator
- VectorVest Watchdog
