HOT TOPICS LIST
- MACD
- Fibonacci
- RSI
- Gann
- ADXR
- Stochastics
- Volume
- Triangles
- Futures
- Cycles
- Volatility
- ZIGZAG
- MESA
- Retracement
- Aroon
INDICATORS LIST
LIST OF TOPICS
PRINT THIS ARTICLE
by Gary Grosschadl
Canadian Pacific Railway (CP) is a transcontinental carrier operating in Canada and the US. Second quarter earnings propelled the stock upward.
Position: Buy
Gary Grosschadl
Independent Canadian equities trader and technical analyst based in Peterborough
Ontario, Canada.
PRINT THIS ARTICLE
CHART ANALYSIS
Full Steam Ahead For Canadian Pacific Railway
08/01/05 12:11:26 PMby Gary Grosschadl
Canadian Pacific Railway (CP) is a transcontinental carrier operating in Canada and the US. Second quarter earnings propelled the stock upward.
Position: Buy
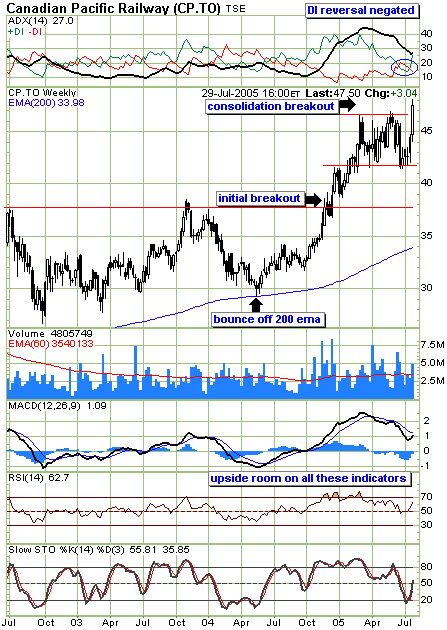
| Late in 2004 this stock broke into all-time high territory. The weekly chart below shows this breakout and the current breakout from a rectangle pattern. The rectangle is a continuation pattern that forms as a trading range during a pause in the trend. Rectangles are sometimes referred to as trading ranges, consolidation zones, or congestion areas. |
| The breakout volume is expanding but not exceptional. Volume needs to stay robust or the breakout move could falter. A modest target would be a move equal to the height of the rectangle before taking another pause. For CP, that would be a move to about $52 where another consolidation could occur. A close below the breakout point of $47 could signal a false move. |

|
| Figure 1: Weekly chart of CP shows a strong uptrend. |
| Graphic provided by: StockCharts.com. |
| |
| The displayed indicators all show good upside potential. The directional movement indicator at the top of the chart shows a reversal of the DIs or directional movement indicators. Shortly after the bears assumed temporary control (-DI over +DI), the bulls once again took charge. With the ADX at a healthy level of 27, trend strength is good which may fuel further moves. |
| The lower indicators all show upside room. Note the RSI (relative strength indicator) shows a bounce off its key 50 level - this often points to good upward momentum. |
Independent Canadian equities trader and technical analyst based in Peterborough
Ontario, Canada.
| Website: | www.whatsonsale.ca/financial.html |
| E-mail address: | gwg7@sympatico.ca |
Click here for more information about our publications!
Comments
Date: 08/02/05Rank: 5Comment:

Request Information From Our Sponsors
- StockCharts.com, Inc.
- Candle Patterns
- Candlestick Charting Explained
- Intermarket Technical Analysis
- John Murphy on Chart Analysis
- John Murphy's Chart Pattern Recognition
- John Murphy's Market Message
- MurphyExplainsMarketAnalysis-Intermarket Analysis
- MurphyExplainsMarketAnalysis-Visual Analysis
- StockCharts.com
- Technical Analysis of the Financial Markets
- The Visual Investor
- VectorVest, Inc.
- Executive Premier Workshop
- One-Day Options Course
- OptionsPro
- Retirement Income Workshop
- Sure-Fire Trading Systems (VectorVest, Inc.)
- Trading as a Business Workshop
- VectorVest 7 EOD
- VectorVest 7 RealTime/IntraDay
- VectorVest AutoTester
- VectorVest Educational Services
- VectorVest OnLine
- VectorVest Options Analyzer
- VectorVest ProGraphics v6.0
- VectorVest ProTrader 7
- VectorVest RealTime Derby Tool
- VectorVest Simulator
- VectorVest Variator
- VectorVest Watchdog
