HOT TOPICS LIST
- MACD
- Fibonacci
- RSI
- Gann
- ADXR
- Stochastics
- Volume
- Triangles
- Futures
- Cycles
- Volatility
- ZIGZAG
- MESA
- Retracement
- Aroon
INDICATORS LIST
LIST OF TOPICS
PRINT THIS ARTICLE
by David Penn
Horizontal support + downwardly sloping resistance trendline = descending triangle. But that's the easy part.
Position: N/A
David Penn
Technical Writer for Technical Analysis of STOCKS & COMMODITIES magazine, Working-Money.com, and Traders.com Advantage.
PRINT THIS ARTICLE
TRIANGLES
The QQQQ's Descending Triangle Breakout
08/01/05 12:09:57 PMby David Penn
Horizontal support + downwardly sloping resistance trendline = descending triangle. But that's the easy part.
Position: N/A
| For all the anxiety and frustration traders feel when confronted with symmetrical triangles and diamond patterns--chart consolidations from which it is notoriously difficult to anticipate the direction of breakouts and breakdowns--directional triangles are supposed to be a walk in the park. |
| Horizontal resistance and upwardly sloped support? Ascending triangle! We're headed higher! Horizontal support and downwardly sloped resistance? Descending triangle! We're headed lower! |

|
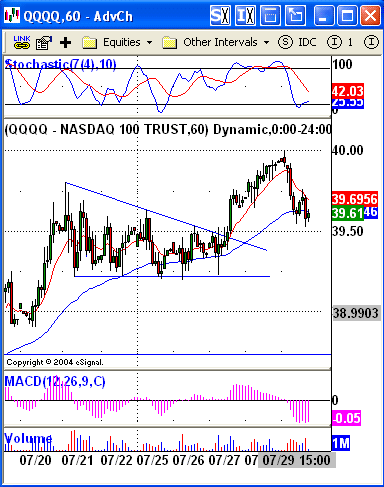
| Figure 1: Even though the QQQQ broke out to the upside from this otherwise bearish descending triangle, prices managed to reach the same sort of minimum price objective that would have been expected had prices broken down and moved lower instead. |
| Graphic provided by: eSignal. |
| |
| Or at least that's supposed to be how it works. Providing an example of a "busted pattern" in the second edition of his Encyclopedia of Chart Patterns, author and trader Thomas Bulkowski suggests a few reasons why a descending triangle--such as the one in Figure 1--might result in a breakout to the upside, rather than a breakdown, as would be expected from such a pattern. Often, he suggests, it is something as straightforward as "underlying support and a bull market." |
| And looking at the descending triangle in Figure 1, there is certainly the "bull market" argument in favor of the upside break--as opposed to the anticipated downside break. Prices were rallying into the descending triangle and that rally--which began at 36 and ended around 39.50--was nothing to sneeze at. Nevertheless, as Bulkowski's research shows, there are plenty of instances in which descending triangles have appeared at the top of trends in order to reverse them. So there was ample reason to take seriously the potential bearishness of the descending triangle in the hourly QQQQ chart. Fortunately for those watching this descending triangle, the trap door--in the form of a brief breach of horizontal support--never materialized. Such trap doors are often called "bear traps" because by feigning a breakdown, they tempt many investors and traders to sell--only to have the market reverse suddenly and begin moving higher. Often in such situations, it is the physics of short sellers scrambling to cover their positions that actually serves to move the market higher--making the trap all the more painful for those unable to escape quickly. |
| What is especially interesting about this descending triangle in the hourly chart of the QQQQ is how the break to the upside actually traveled the precise minimum distance as anticipated by the size of the triangle. In other words, if we take the formation size of the triangle at its widest point (just shy of 60 cents), and add that amount to the value at the breakout (about 39.45), we get a minimum upside of about 40 cents. The QQQQ broke out around 10 a.m. Thursday morning. It reached 40 cents to the penny in pre-opening trading Friday. |
Technical Writer for Technical Analysis of STOCKS & COMMODITIES magazine, Working-Money.com, and Traders.com Advantage.
| Title: | Technical Writer |
| Company: | Technical Analysis, Inc. |
| Address: | 4757 California Avenue SW |
| Seattle, WA 98116 | |
| Phone # for sales: | 206 938 0570 |
| Fax: | 206 938 1307 |
| Website: | www.Traders.com |
| E-mail address: | DPenn@traders.com |
Traders' Resource Links | |
| Charting the Stock Market: The Wyckoff Method -- Books | |
| Working-Money.com -- Online Trading Services | |
| Traders.com Advantage -- Online Trading Services | |
| Technical Analysis of Stocks & Commodities -- Publications and Newsletters | |
| Working Money, at Working-Money.com -- Publications and Newsletters | |
| Traders.com Advantage -- Publications and Newsletters | |
| Professional Traders Starter Kit -- Software | |
Click here for more information about our publications!
Comments
Date: 08/02/05Rank: 4Comment:

Request Information From Our Sponsors
- StockCharts.com, Inc.
- Candle Patterns
- Candlestick Charting Explained
- Intermarket Technical Analysis
- John Murphy on Chart Analysis
- John Murphy's Chart Pattern Recognition
- John Murphy's Market Message
- MurphyExplainsMarketAnalysis-Intermarket Analysis
- MurphyExplainsMarketAnalysis-Visual Analysis
- StockCharts.com
- Technical Analysis of the Financial Markets
- The Visual Investor
- VectorVest, Inc.
- Executive Premier Workshop
- One-Day Options Course
- OptionsPro
- Retirement Income Workshop
- Sure-Fire Trading Systems (VectorVest, Inc.)
- Trading as a Business Workshop
- VectorVest 7 EOD
- VectorVest 7 RealTime/IntraDay
- VectorVest AutoTester
- VectorVest Educational Services
- VectorVest OnLine
- VectorVest Options Analyzer
- VectorVest ProGraphics v6.0
- VectorVest ProTrader 7
- VectorVest RealTime Derby Tool
- VectorVest Simulator
- VectorVest Variator
- VectorVest Watchdog
