HOT TOPICS LIST
- MACD
- Fibonacci
- RSI
- Gann
- ADXR
- Stochastics
- Volume
- Triangles
- Futures
- Cycles
- Volatility
- ZIGZAG
- MESA
- Retracement
- Aroon
INDICATORS LIST
LIST OF TOPICS
PRINT THIS ARTICLE
by David Penn
Those looking for an end to the boom in housing can begin by plotting the upside of housing stocks.
Position: N/A
David Penn
Technical Writer for Technical Analysis of STOCKS & COMMODITIES magazine, Working-Money.com, and Traders.com Advantage.
PRINT THIS ARTICLE
ELLIOTT WAVE
An Elliott Wave Count In Housing
07/29/05 02:16:37 PMby David Penn
Those looking for an end to the boom in housing can begin by plotting the upside of housing stocks.
Position: N/A
| My last look at housing stocks for Traders.com Advantage was back in April and, unfortunately, I was not talking about the likely bottom in mid-May ("A Head And Shoulders Top In Housing Stocks," April 29, 2005). I was bearish then, and taking a look back at the price chart I had to work with at the time actually makes me feel better about the call. To steal from my favorite administration wordsmith, you go to the market with the price chart you have, not the price chart you wish you had. |
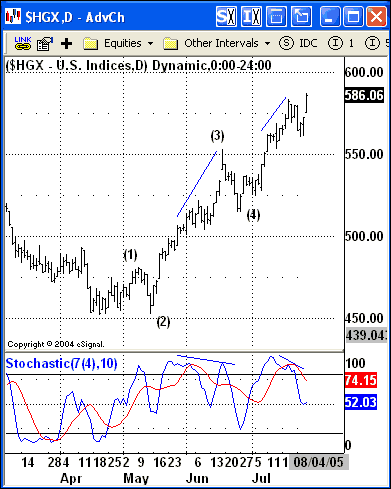
| In fact, what I had thought would be the right shoulder of the head and shoulders top actually has turned out to be the wave 1 top and the wave 2 bottom of a bullish move up. |

|
| Figure 1: If the wave count in $HGX is accurate, then housing stocks are headed on at least one more glorious ride higher before any significant correction can take place. |
| Graphic provided by: eSignal. |
| |
| I've been spending some time in one of the more popular trading message-board forums reading some of the gloating by housing bulls, who've clearly become fed up with all the doomsday talk of the "housing bubble." The chart in Figure 1 -- or, more essentially, the wave count in Figure 1 -- suggests that the gloating is likely to continue for the near term. Assuming this wave count is accurate, then Fischer projections of the top present some interesting challenges. (For more on Fischer projections, see Robert Fischer's book, Fibonacci Applications And Strategies For Traders.) Fischer projections involve multiplying the length of waves 1 and 3 by Fibonacci multiples 1.618 and 0.618, respectively. Adding that product to the value at the tops of waves 1 and 3 then provides a range of likely levels where wave 5 will top. The math is as follows: Wave 1: 26.72 x 1.618 = 43.23 43.23 + 480.15 = 523.38 Wave 3: 99.77 x 0.618 = 61.66 61.66 + 553.20 = 614.86 The Fischer projections suggest that wave 5 will top somewhere between 523.38 and 614.86. The relatively low value for the wave 1 projection is little surprise; I've found that often wave 1 projections in and of themselves do a better job of anticipating the wave 3 top than the wave 5. At the same time, wave 3 projections tend to overestimate the distance wave 5 will travel before topping. Here we have a case, perhaps, of both. The wave 1 projection seems too modest, and the wave 3 projection may be a little too ambitious. Unfortunately, averaging the two projections -- which often yields a more accurate number -- is of little use here. Averaged together, the projections provide a wave 5 top near 570 -- which is below current levels. How to work around this? My suspicion is that this means wave 5 will likely be an extended wave, with a clear five-wave subpattern that will (or rather, already has) pushed the wave 5 top higher than might have otherwise been anticipated. As such, my initial thought was to focus on the higher value, the 614-615 range suggested by the wave 3 projection, as a likely place for wave 5 to reach its conclusion. Fischer suggests something else. He writes: "When working with the extension in wave 5, multiply the total amplitude from the beginning of wave 1 to the top of wave 3 by the Fibonacci ratio 1.618 to get the price goal for the end of wave 5." In the current context, this would mean: Wave 3: 99.77 x 1.618 = 161.43 161.43 + 553.2 = 714.63 Or quite a bit of upside ahead for $HGX, indeed. |

|
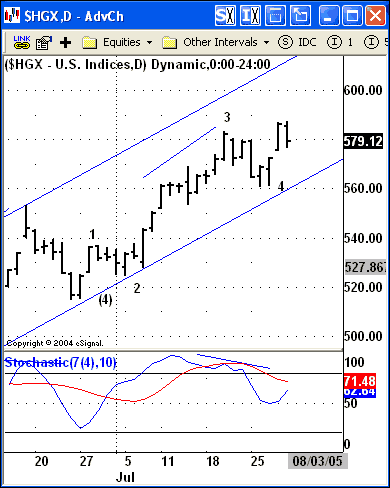
| Figure 2: A potential wave count for the extension in wave 5. |
| Graphic provided by: eSignal. |
| |
| I've taken another look at the first few waves of the potential fifth-wave extension in $HGX and applied the same basic Fischer projections to this series of subwaves. The results are as follows: Sub 1 of sub 5: 22 x 1.618 = 35.6 35.6 + 537 = 572.6 Sub 3 of sub 5: 68 x 0.618 = 42 42 + 583 = 625 Averaging these two projections provides a projected wave 5/subwave 5 peak at 598.8. An inconclusive conclusion, to be sure. But keep these levels in mind: 599, 615, and 715 as the $HGX moves higher. |
Technical Writer for Technical Analysis of STOCKS & COMMODITIES magazine, Working-Money.com, and Traders.com Advantage.
| Title: | Technical Writer |
| Company: | Technical Analysis, Inc. |
| Address: | 4757 California Avenue SW |
| Seattle, WA 98116 | |
| Phone # for sales: | 206 938 0570 |
| Fax: | 206 938 1307 |
| Website: | www.Traders.com |
| E-mail address: | DPenn@traders.com |
Traders' Resource Links | |
| Charting the Stock Market: The Wyckoff Method -- Books | |
| Working-Money.com -- Online Trading Services | |
| Traders.com Advantage -- Online Trading Services | |
| Technical Analysis of Stocks & Commodities -- Publications and Newsletters | |
| Working Money, at Working-Money.com -- Publications and Newsletters | |
| Traders.com Advantage -- Publications and Newsletters | |
| Professional Traders Starter Kit -- Software | |
Click here for more information about our publications!
Comments
Date: 07/30/05Rank: 3Comment:
Date: 08/02/05Rank: 2Comment:

Request Information From Our Sponsors
- StockCharts.com, Inc.
- Candle Patterns
- Candlestick Charting Explained
- Intermarket Technical Analysis
- John Murphy on Chart Analysis
- John Murphy's Chart Pattern Recognition
- John Murphy's Market Message
- MurphyExplainsMarketAnalysis-Intermarket Analysis
- MurphyExplainsMarketAnalysis-Visual Analysis
- StockCharts.com
- Technical Analysis of the Financial Markets
- The Visual Investor
- VectorVest, Inc.
- Executive Premier Workshop
- One-Day Options Course
- OptionsPro
- Retirement Income Workshop
- Sure-Fire Trading Systems (VectorVest, Inc.)
- Trading as a Business Workshop
- VectorVest 7 EOD
- VectorVest 7 RealTime/IntraDay
- VectorVest AutoTester
- VectorVest Educational Services
- VectorVest OnLine
- VectorVest Options Analyzer
- VectorVest ProGraphics v6.0
- VectorVest ProTrader 7
- VectorVest RealTime Derby Tool
- VectorVest Simulator
- VectorVest Variator
- VectorVest Watchdog
