HOT TOPICS LIST
- MACD
- Fibonacci
- RSI
- Gann
- ADXR
- Stochastics
- Volume
- Triangles
- Futures
- Cycles
- Volatility
- ZIGZAG
- MESA
- Retracement
- Aroon
INDICATORS LIST
LIST OF TOPICS
PRINT THIS ARTICLE
by Gary Grosschadl
The daily chart for this largest oilseed processor in the world shows a sizeable short-term retracement.
Position: N/A
Gary Grosschadl
Independent Canadian equities trader and technical analyst based in Peterborough
Ontario, Canada.
PRINT THIS ARTICLE
FIBONACCI
Bungee Jumping With Bunge Ltd.
07/29/05 02:00:01 PMby Gary Grosschadl
The daily chart for this largest oilseed processor in the world shows a sizeable short-term retracement.
Position: N/A
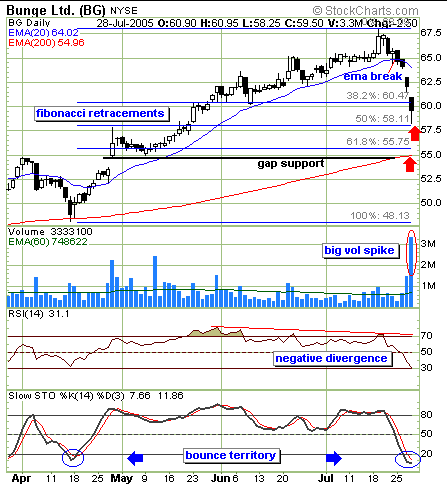
| Buying the dips on a strong stock in a major uptrend is one of the popular mantras of fund managers. The large volume signal here in conjunction with a bottom hammer candlestick will attract a lot of attention. Is now a good time to load up? |
| Looking back on this chart, those traders who took the opportunity to purchase shares when the stock bounced off the often important 200-day EMA (exponential moving average) did very well indeed. The ensuing strong uptrend was well mapped out by the excellent support offered by the 20-day EMA. By the same measure, an important short-term break occurred when the stock closed below this same EMA. Traders choosing to act on this simple sell signal cashed out at an attractive level. The technical trader should have also noted the telling negative divergence on the RSI (relative strength indicator), giving advance warning that a support break was approaching. |

|
| The daily chart for Bunge Ltd. suggests buying opportunities. |
| Graphic provided by: StockCharts.com. |
| |
| Technical traders will often consider Fibonacci retracement levels when trying to gauge how far a downleg may occur. On this chart, using the high and low, common charting software plots the most popular retracement levels. Note the possible bottom hammer signal relating to the 50% retracement level. The fact that this is accompanied with heavy, abnormal trading volume suggests that buying triggers have been hit. Of course the other side of the coin suggests other traders may be abandoning positions with a break below the $60 level. It all depends where you draw your line in the sand. Speaking of which - this chart suggests a strong line at the proven support of the 200-day EMA. Note how this also relates to previous gap support in the $55 area. |
| So, back to the previous question - is this a good time to load up? My answer is probably. Even if there is a chance of further downside, it is near heavy support at $55. Should it move towards this level, there will be heavy buying again so why not accumulate now at this attractive 50% Fibonacci level? This may be the bounce level going forward. |
| Going forward, watch for a confirming close above the hammer candlestick (or next downside target may approach $55), and possible upside resistance at the 20-day EMA. In other words, some traders may be targeting a possible "failure move" to the support break parameter of the 20-day EMA, currently at $64. |
Independent Canadian equities trader and technical analyst based in Peterborough
Ontario, Canada.
| Website: | www.whatsonsale.ca/financial.html |
| E-mail address: | gwg7@sympatico.ca |
Click here for more information about our publications!
PRINT THIS ARTICLE

Request Information From Our Sponsors
- StockCharts.com, Inc.
- Candle Patterns
- Candlestick Charting Explained
- Intermarket Technical Analysis
- John Murphy on Chart Analysis
- John Murphy's Chart Pattern Recognition
- John Murphy's Market Message
- MurphyExplainsMarketAnalysis-Intermarket Analysis
- MurphyExplainsMarketAnalysis-Visual Analysis
- StockCharts.com
- Technical Analysis of the Financial Markets
- The Visual Investor
- VectorVest, Inc.
- Executive Premier Workshop
- One-Day Options Course
- OptionsPro
- Retirement Income Workshop
- Sure-Fire Trading Systems (VectorVest, Inc.)
- Trading as a Business Workshop
- VectorVest 7 EOD
- VectorVest 7 RealTime/IntraDay
- VectorVest AutoTester
- VectorVest Educational Services
- VectorVest OnLine
- VectorVest Options Analyzer
- VectorVest ProGraphics v6.0
- VectorVest ProTrader 7
- VectorVest RealTime Derby Tool
- VectorVest Simulator
- VectorVest Variator
- VectorVest Watchdog
