HOT TOPICS LIST
- MACD
- Fibonacci
- RSI
- Gann
- ADXR
- Stochastics
- Volume
- Triangles
- Futures
- Cycles
- Volatility
- ZIGZAG
- MESA
- Retracement
- Aroon
INDICATORS LIST
LIST OF TOPICS
PRINT THIS ARTICLE
by Paolo Pezzutti
The yuan was revalued, but not as expected. Are bigger changes coming?
Position: N/A
Paolo Pezzutti
Author of the book "Trading the US Markets - A Comprehensive Guide to US Markets for International Traders and Investors" - Harriman House (July 2008)
PRINT THIS ARTICLE
CURRENCY TRADING
Forex USD/JPY: The Currencies After China's Revaluation
07/29/05 02:02:30 PMby Paolo Pezzutti
The yuan was revalued, but not as expected. Are bigger changes coming?
Position: N/A
| The news of the yuan revaluation made a big splash in the media last week. On July 21, China took an important political step, shifting away its peg of the yuan from the US dollar to an undisclosed basket of currencies. The move revalues the yuan by 2.1% against the US dollar. The impact on global economies, however, is expected to be low. China's move is considerably short of US expectations in recent months (some say by more than 15%). In fact, keeping its currency weak gives China an advantage in trade. Beijing evidently hopes this will ease protectionist pressure in the US. There have been calls in Congress for tariffs against Chinese goods, but it's unclear if the move will be enough to quiet the discussion. But will China revalue even further? There is a potential challenge for China in introducing a managed float; a small revaluation would continue to attract speculative foreign capital in anticipation of further currency appreciation. What is the impact of the move on currency markets? There might be a reduction in the flow of investments in Treasury bonds coming from China and consequent support to the Euro and Yen value against the US$. It is not known, however, how far the reduction will go. A decrease in Treasury prices, on the other hand, would increase the interest rate difference between the US and Europe, probably attracting investments in US$. The scenarios are complex, making it difficult to weigh the impact of the different variables to predict the new equilibrium point. We can look at the technical conditions to understand how the markets are perceiving the impact of the new information available. |
| I used the moving average convergence divergence (MACD) indicator to support the analysis. It calculates two exponential moving averages of lengths specified by inputs. The difference between these two averages is then plotted as the MACD. This value is also averaged for the number of bars specified by another input and then plotted as the MACD average. Finally, the difference between the MACD and the MACD average is calculated and plotted as the MACDDiff. When the MACD crosses above the MACD average, it may be the beginning of an uptrend. Conversely, when the MACD crosses below the MACD average, it may be the beginning of a downtrend. As an oscillator, the MACD can indicate overbought and oversold conditions. |

|
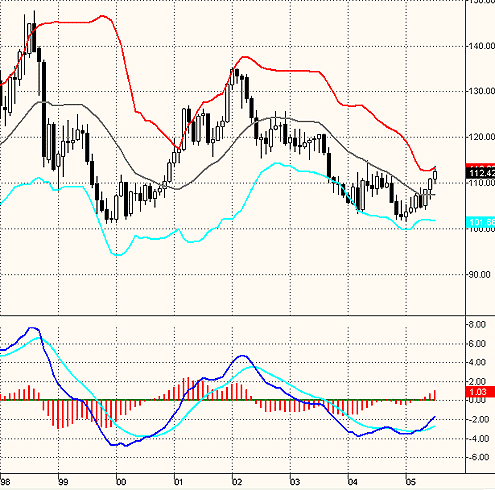
| Figure 1. Monthly chart of the Forex USD/JPY |
| Graphic provided by: TradeStation. |
| |
| Figure 1 shows the monthly chart of the Forex USD/JPY. At the beginning of 2005 the USD formed a new relative low. Note that prices did not manage to tag the lower Bollinger Band as they did at the end of the March 2004 low. Additionally, the MACD showed a significant divergence. The following reaction brought prices up to cross the moving average and tag the upper band. At the monthly level, the volatility in this phase has been going down during the past two years. |

|
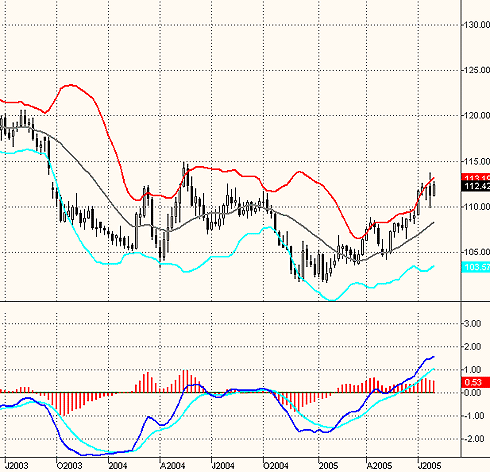
| Figure 2. The weekly chart displays the uptrend started at the beginning of 2005. |
| Graphic provided by: TradeStation. |
| |
| In Figure 2, the weekly chart displays the same situation as the monthly chart. Also in this time frame there is a significant divergence of the MACD between the March low and the beginning of 2005 low. Note also the double low formed in November 2004 and January 2005. The second low did not manage to tag the lower Bollinger Band with a divergence of the MACD and the MACDDiff. This is a typical pattern to be traded with good confidence and an acceptable risk-reward ratio. Since January 2005, prices started an uptrend. The lower band now has turned up parallel to the upper band to indicate, together with a decreasing MACDDiff, at least a temporary stop of the impulse to the upside. |

|
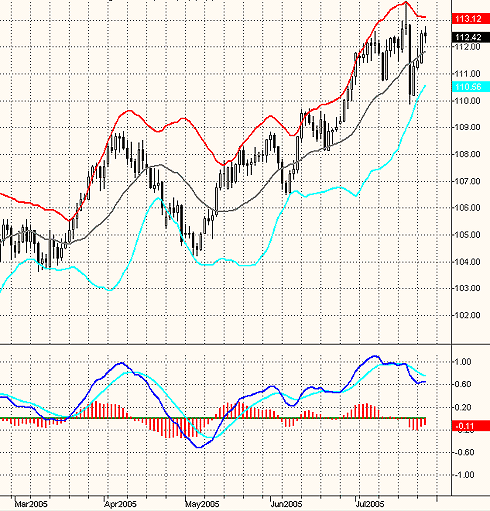
| Figure 3. Daily chart. Note the significant MACD divergence and the wide-ranging bar that formed on the day of China's move. |
| Graphic provided by: TradeStation. |
| |
| In Figure 3, the daily chart displays the uptrend of the last few months. Note the divergence of the MACD between the beginning of the July top and the one formed on July 20th. Of course, the important event is the wide-ranging bar that formed the next day in coincidence with China's move to revalue its currency. This bar signals at least a change in attitude of the investors. The news took investors by surprise and had a negative impact on prices. During the last trading days, prices were retesting the previous top. This phase is crucial in understanding the next developments. At the same time, the Bollinger Bands are converging and indicate probably the beginning of a congestion or, at best, a trading range phase. In the past months, the uptrend brought prices consistently higher. China's move had an strong, emotional impact on prices. I would say that this event and the market's reaction will continue to influence the USD/JPY in the future. When deciding their strategies, traders have to take it into account. |
Author of the book "Trading the US Markets - A Comprehensive Guide to US Markets for International Traders and Investors" - Harriman House (July 2008)
| Address: | VIA ROBERTO AGO 26 POSTAL CODE 00166 |
| Rome, ITALY | |
| Phone # for sales: | +393357540708 |
| E-mail address: | pezzutti.paolo@tiscali.it |
Click here for more information about our publications!
Comments
Date: 07/30/05Rank: 3Comment:

Request Information From Our Sponsors
- StockCharts.com, Inc.
- Candle Patterns
- Candlestick Charting Explained
- Intermarket Technical Analysis
- John Murphy on Chart Analysis
- John Murphy's Chart Pattern Recognition
- John Murphy's Market Message
- MurphyExplainsMarketAnalysis-Intermarket Analysis
- MurphyExplainsMarketAnalysis-Visual Analysis
- StockCharts.com
- Technical Analysis of the Financial Markets
- The Visual Investor
- VectorVest, Inc.
- Executive Premier Workshop
- One-Day Options Course
- OptionsPro
- Retirement Income Workshop
- Sure-Fire Trading Systems (VectorVest, Inc.)
- Trading as a Business Workshop
- VectorVest 7 EOD
- VectorVest 7 RealTime/IntraDay
- VectorVest AutoTester
- VectorVest Educational Services
- VectorVest OnLine
- VectorVest Options Analyzer
- VectorVest ProGraphics v6.0
- VectorVest ProTrader 7
- VectorVest RealTime Derby Tool
- VectorVest Simulator
- VectorVest Variator
- VectorVest Watchdog
