HOT TOPICS LIST
- MACD
- Fibonacci
- RSI
- Gann
- ADXR
- Stochastics
- Volume
- Triangles
- Futures
- Cycles
- Volatility
- ZIGZAG
- MESA
- Retracement
- Aroon
INDICATORS LIST
LIST OF TOPICS
PRINT THIS ARTICLE
by David Penn
Running negative stochastic divergences all but assure lower crude oil prices in the immediate-term.
Position: N/A
David Penn
Technical Writer for Technical Analysis of STOCKS & COMMODITIES magazine, Working-Money.com, and Traders.com Advantage.
PRINT THIS ARTICLE
STOCHASTICS
Crude Comes In
07/29/05 02:00:57 PMby David Penn
Running negative stochastic divergences all but assure lower crude oil prices in the immediate-term.
Position: N/A
| In a recent article for Traders.com Advantage, regular contributor Gary Grosschadl did oil stock traders and investors a great service by pointing out the potential for underlying weakness in the AMEX Oil Index ("Oil Index Ripe for Correction," July 7, 2005). This article looks more specifically at crude oil itself--and arrives at similarly bearish conclusions. |
| September crude has traded above its 50-day exponential moving average since breaking out in June. With the exception of one close below the 50-day EMA in mid-July, this intermediate-term moving average has proved to be effective support over the past several weeks. And any bearish commentary or observations need to take this into account. |

|
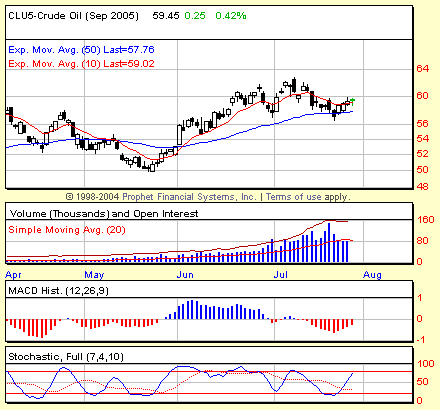
| Figure 1:Two higher highs in price relative to the mini-peak in early June correspond with two lower highs in the stochastic--and suggest that the correction in crude might not be over. |
| Graphic provided by: Prophet Financial, Inc. |
| |
| That said, if crude's status above the 50-day EMA is the dominant technical feature, then the set of negative stochastic divergences beginning in late June might well be second in line. The first negative divergences begin in June, as higher highs in September crude are matched with lower highs in the stochastic oscillator. This negative divergence most likely anticipated the dip toward the end of the month--as well as intimating potential difficulties ahead. |
| As prices surged higher in early July, the stochastic advanced as well. However, the stochastic again failed to make a higher high as prices for September crude did. Another negative divergence and another decline in crude oil as prices slipped once again toward the middle of the month. |
| Individually, these negative divergences have produced pullbacks--barely corrections--that probably appeared more like buying opportunities in a bullish trend than the storm clouds they might otherwise be. Taken together over the course of a month and a half, though, the series of three higher highs in price matched with lower highs in the stochastic can only serve as a warning for those who can find little reason for oil prices to move lower. |
Technical Writer for Technical Analysis of STOCKS & COMMODITIES magazine, Working-Money.com, and Traders.com Advantage.
| Title: | Technical Writer |
| Company: | Technical Analysis, Inc. |
| Address: | 4757 California Avenue SW |
| Seattle, WA 98116 | |
| Phone # for sales: | 206 938 0570 |
| Fax: | 206 938 1307 |
| Website: | www.Traders.com |
| E-mail address: | DPenn@traders.com |
Traders' Resource Links | |
| Charting the Stock Market: The Wyckoff Method -- Books | |
| Working-Money.com -- Online Trading Services | |
| Traders.com Advantage -- Online Trading Services | |
| Technical Analysis of Stocks & Commodities -- Publications and Newsletters | |
| Working Money, at Working-Money.com -- Publications and Newsletters | |
| Traders.com Advantage -- Publications and Newsletters | |
| Professional Traders Starter Kit -- Software | |
Click here for more information about our publications!
Comments
Date: 07/30/05Rank: 3Comment:
Date: 08/02/05Rank: 5Comment:

Request Information From Our Sponsors
- StockCharts.com, Inc.
- Candle Patterns
- Candlestick Charting Explained
- Intermarket Technical Analysis
- John Murphy on Chart Analysis
- John Murphy's Chart Pattern Recognition
- John Murphy's Market Message
- MurphyExplainsMarketAnalysis-Intermarket Analysis
- MurphyExplainsMarketAnalysis-Visual Analysis
- StockCharts.com
- Technical Analysis of the Financial Markets
- The Visual Investor
- VectorVest, Inc.
- Executive Premier Workshop
- One-Day Options Course
- OptionsPro
- Retirement Income Workshop
- Sure-Fire Trading Systems (VectorVest, Inc.)
- Trading as a Business Workshop
- VectorVest 7 EOD
- VectorVest 7 RealTime/IntraDay
- VectorVest AutoTester
- VectorVest Educational Services
- VectorVest OnLine
- VectorVest Options Analyzer
- VectorVest ProGraphics v6.0
- VectorVest ProTrader 7
- VectorVest RealTime Derby Tool
- VectorVest Simulator
- VectorVest Variator
- VectorVest Watchdog
