HOT TOPICS LIST
- MACD
- Fibonacci
- RSI
- Gann
- ADXR
- Stochastics
- Volume
- Triangles
- Futures
- Cycles
- Volatility
- ZIGZAG
- MESA
- Retracement
- Aroon
INDICATORS LIST
LIST OF TOPICS
PRINT THIS ARTICLE
by Paolo Pezzutti
Spikes are a powerful pattern for traders.
Position: N/A
Paolo Pezzutti
Author of the book "Trading the US Markets - A Comprehensive Guide to US Markets for International Traders and Investors" - Harriman House (July 2008)
PRINT THIS ARTICLE
CHART ANALYSIS
One-Day Patterns: Spikes
07/29/05 12:02:19 PMby Paolo Pezzutti
Spikes are a powerful pattern for traders.
Position: N/A
| A one-day pattern described by Jack Schwager in his 1995 book Schwager on Futures: Technical Analysis is the "spike." This powerful pattern is based on the extreme psychological conditions that occur through crowd participation in the marketplace. The more extreme the conditions, the greater the chance that a spike will form and become an important turning point in the market. Let's try and define a spike. A spike has its low sharply below the low of the previous and the succeeding trading days. Frequently, the close will be in the upper part of the range. It is significant after a period of declining prices and represents a climax in selling pressure. The opposite is true for spike highs. Often spikes are associated with events that impact on crowd emotions and ignite mass, mainly irrational, reactions. Fear, for example, can trigger a crowd sell-off at the release of bad news. The selling pressure is fast and big market orders leave voids in the book. A wave of panic selling hits the equity. At the end of the sell-off, when it looks difficult to find a buyer at any price, suddenly, the crowd realizes they've overreacted to the event. This might be due to more accurate information provided by the media about the event itself, or simply by a rational re-evaluation of the situation. With the same speed prices dropped, the buying pressure brings prices back up again! Trading a spike requires strong nerves to navigate the extreme volatility. Schwager suggests that "the significance of a spike low will be enhanced by the following factors: - A wide difference between the lows of the preceding and succeeding days and the spike low; - A close near the high of the day's range; - A substantial price decline preceding the spike's formation." Schwager then tried to mathematically define a spike. Note that a spike represents a sharp increase in volatility that provides an opportunity to profit. With that comes an increase in volume, indicating high crowd participation in the marketplace. At this point risk management becomes extremely important. Spike lows could represent relative lows in the market, or they could be a failure of the pattern, such as the breakdown of a spike low. This can be also a powerful pattern to trade. Let's see some examples. |

|
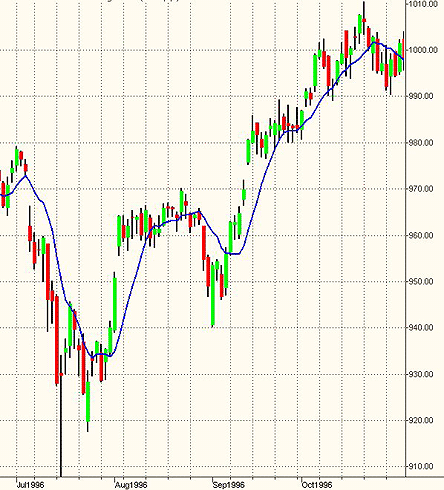
| Figure 1. A powerful spike in the S&P Future contract back in 1996. |
| Graphic provided by: TradeStation. |
| |
| Looking at the S&P Future Contract daily chart, a spike formed on July 16, 1996. During June prices went down with wide range bars in the sessions preceding the spike. The sell-off started at the beginning of the trading session, but prices closed near the opening. Note that after the spike, prices retested the low with no success. This is a typical pattern to enter a controlled risk trade. |

|
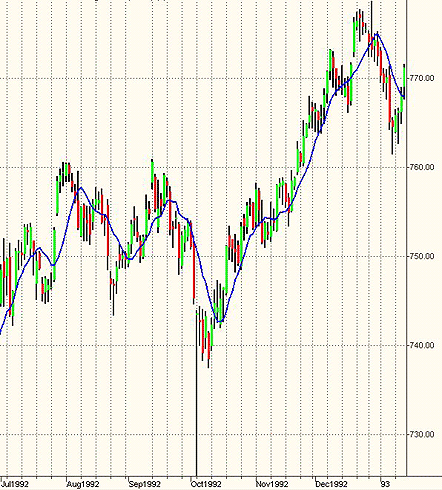
| Figure 2. Another impressive spike in the 1992 daily chart of the S&P Future contract. |
| Graphic provided by: TradeStation. |
| |
| Another nice spike formed on the S&P Future contract back on October 5, 1992. This was the start of an uptrend lasting for the next three months. Often spikes mark major reversal points. |

|
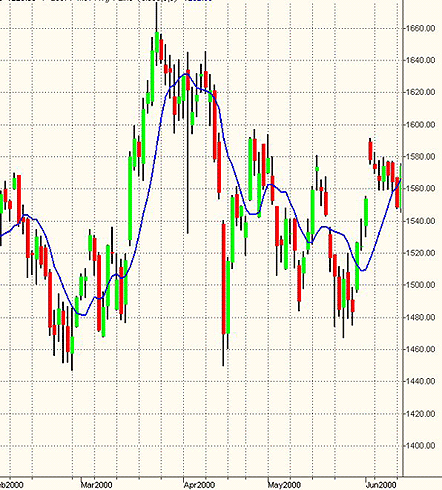
| Figure 3. S&P daily chart: a failed pattern. |
| Graphic provided by: TradeStation. |
| |
| In Figure 3, the S&P Future contract daily chart formed a spike on April 4, 2000. It did not occur under Schwager's ideal conditions. In fact, this spike low formed after an uptrend, rather than at the end of a downtrend. Note that the retest of the spike low occurred in an extremely volatile environment with a big gap right at support levels. It ended with a breakdown. This pattern, as with every pattern, does not guarantee a win! |

|
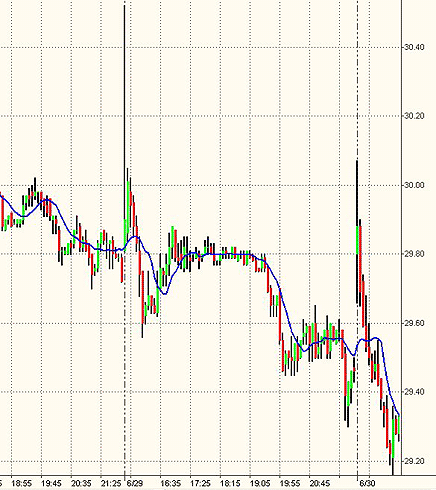
| Figure 4. Two spikes on a 15-minute stock intraday chart. |
| Graphic provided by: TradeStation. |
| |
| Figure 4 shows two opportunities on the 15-minute intraday chart. In both cases, there was a gap at the open, with a significant spike bar. Right after that, the spike prices started to run, filling the gap on a trend day. Weak hands were shaken at the open. With no sellers left, the market was ready to start rising, profiting from new buyers and short covers. In summary, spikes are another powerful tool in your collection of short-term patterns. Risk management is very important because of the volatile environment surrounding their formation. |
Author of the book "Trading the US Markets - A Comprehensive Guide to US Markets for International Traders and Investors" - Harriman House (July 2008)
| Address: | VIA ROBERTO AGO 26 POSTAL CODE 00166 |
| Rome, ITALY | |
| Phone # for sales: | +393357540708 |
| E-mail address: | pezzutti.paolo@tiscali.it |
Click here for more information about our publications!
Comments
Date: 07/30/05Rank: 3Comment:
Date: 08/02/05Rank: 5Comment:

Request Information From Our Sponsors
- StockCharts.com, Inc.
- Candle Patterns
- Candlestick Charting Explained
- Intermarket Technical Analysis
- John Murphy on Chart Analysis
- John Murphy's Chart Pattern Recognition
- John Murphy's Market Message
- MurphyExplainsMarketAnalysis-Intermarket Analysis
- MurphyExplainsMarketAnalysis-Visual Analysis
- StockCharts.com
- Technical Analysis of the Financial Markets
- The Visual Investor
- VectorVest, Inc.
- Executive Premier Workshop
- One-Day Options Course
- OptionsPro
- Retirement Income Workshop
- Sure-Fire Trading Systems (VectorVest, Inc.)
- Trading as a Business Workshop
- VectorVest 7 EOD
- VectorVest 7 RealTime/IntraDay
- VectorVest AutoTester
- VectorVest Educational Services
- VectorVest OnLine
- VectorVest Options Analyzer
- VectorVest ProGraphics v6.0
- VectorVest ProTrader 7
- VectorVest RealTime Derby Tool
- VectorVest Simulator
- VectorVest Variator
- VectorVest Watchdog
