HOT TOPICS LIST
- MACD
- Fibonacci
- RSI
- Gann
- ADXR
- Stochastics
- Volume
- Triangles
- Futures
- Cycles
- Volatility
- ZIGZAG
- MESA
- Retracement
- Aroon
INDICATORS LIST
LIST OF TOPICS
PRINT THIS ARTICLE
by David Penn
The index of unhedged gold stocks, $HUI, looks vulnerable to a 1-2-3 trend reversal in the daily charts.
Position: N/A
David Penn
Technical Writer for Technical Analysis of STOCKS & COMMODITIES magazine, Working-Money.com, and Traders.com Advantage.
PRINT THIS ARTICLE
REVERSAL
Huey Needs A New High
07/29/05 12:30:02 PMby David Penn
The index of unhedged gold stocks, $HUI, looks vulnerable to a 1-2-3 trend reversal in the daily charts.
Position: N/A
| One of the wonderful things about technical analysis isn't so much how its techniques help traders know when they are right -- a certitude that can only be attained by the "ringing of the cash register." No, one of the best things about technical analysis is that it provides fairly clear signals to let traders know when they are wrong. Like the saying goes, the upside tends to take care of itself. It's the downside -- or, rather, avoiding or minimizing the downside -- that needs tending to. |
| Back at the beginning of the month, I questioned the then-popular argument that gold was about to embark upon a significant and lasting advance ("The New Gold Bull Market?", July 7, 2005, Traders.com Advantage). At the time, my critique was based on what I thought was a flawed interpretation of corrections in an application of Elliott wave theory to the price of gold. But recent events over the course of July have provided additional reasons why lasting advances in gold (or, at least here, in gold stocks) might not be as likely as some believe them to be. |

|
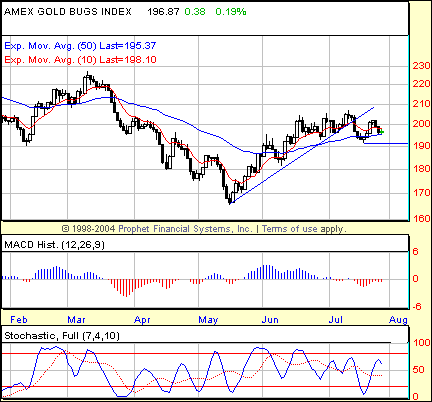
| Has the "Huey" [$HUI] completed stage two of the 1-2-3 trend reversal? Or can gold bulls push the index back above the July highs? |
| Graphic provided by: Prophet Financial, Inc. |
| |
| Those reasons are threefold, as in the 1-2-3 trend reversal setup popularized by Victor Sperandeo in his books, Methods Of A Wall Street Master and Principles Of Professional Speculation. I've written here recently about the 1-2-3 trend reversal in other contexts, namely the yield on the 10-year Treasury note. So rather than repeat the specifics of each stage of the 1-2-3 trend reversal here, I'll just note the current progress of the $HUI as it works its way deeper into -- or out of altogether -- the 1-2-3 trend reversal. Along with the broader stock market, the $HUI had been rallying since late spring after putting in a bottom in mid-May. This rally lasted about two months before prices broke down in July below a trendline that had provided support for the advance. This break was the first step of the 1-2-3 trend reversal. |
| The second step is the attempt to reestablish the original trend. This appears to have taken place in the $HUI over four days from July 19 through July 22. Unfortunately for those long gold stocks, this four-day advance did not manage to set a new high vis-a-vis the previous two-month advance. This was a bearish sign insofar as it suggested that the trendline break was a real turning point, and that bears, not bulls, would have the upper hand in the near term. |
| This is where the $HUI remains. It is still possible for the $HUI picture to become more bullish -- a picture that would snap into focus if the index were able to set a new July high, or even an August high that exceeded the high of July. But every day that does not happen and, instead, the $HUI drifts down closer to the low of the trendline break, the more likely it becomes that the Huey will find itself taking that third step out of what has become a month-long consolidation and into a full-fledged bearish reversal. |
Technical Writer for Technical Analysis of STOCKS & COMMODITIES magazine, Working-Money.com, and Traders.com Advantage.
| Title: | Technical Writer |
| Company: | Technical Analysis, Inc. |
| Address: | 4757 California Avenue SW |
| Seattle, WA 98116 | |
| Phone # for sales: | 206 938 0570 |
| Fax: | 206 938 1307 |
| Website: | www.Traders.com |
| E-mail address: | DPenn@traders.com |
Traders' Resource Links | |
| Charting the Stock Market: The Wyckoff Method -- Books | |
| Working-Money.com -- Online Trading Services | |
| Traders.com Advantage -- Online Trading Services | |
| Technical Analysis of Stocks & Commodities -- Publications and Newsletters | |
| Working Money, at Working-Money.com -- Publications and Newsletters | |
| Traders.com Advantage -- Publications and Newsletters | |
| Professional Traders Starter Kit -- Software | |
Click here for more information about our publications!
Comments
Date: 07/30/05Rank: 3Comment:
Date: 08/02/05Rank: 5Comment:

Request Information From Our Sponsors
- StockCharts.com, Inc.
- Candle Patterns
- Candlestick Charting Explained
- Intermarket Technical Analysis
- John Murphy on Chart Analysis
- John Murphy's Chart Pattern Recognition
- John Murphy's Market Message
- MurphyExplainsMarketAnalysis-Intermarket Analysis
- MurphyExplainsMarketAnalysis-Visual Analysis
- StockCharts.com
- Technical Analysis of the Financial Markets
- The Visual Investor
- VectorVest, Inc.
- Executive Premier Workshop
- One-Day Options Course
- OptionsPro
- Retirement Income Workshop
- Sure-Fire Trading Systems (VectorVest, Inc.)
- Trading as a Business Workshop
- VectorVest 7 EOD
- VectorVest 7 RealTime/IntraDay
- VectorVest AutoTester
- VectorVest Educational Services
- VectorVest OnLine
- VectorVest Options Analyzer
- VectorVest ProGraphics v6.0
- VectorVest ProTrader 7
- VectorVest RealTime Derby Tool
- VectorVest Simulator
- VectorVest Variator
- VectorVest Watchdog
