HOT TOPICS LIST
- MACD
- Fibonacci
- RSI
- Gann
- ADXR
- Stochastics
- Volume
- Triangles
- Futures
- Cycles
- Volatility
- ZIGZAG
- MESA
- Retracement
- Aroon
INDICATORS LIST
LIST OF TOPICS
PRINT THIS ARTICLE
by David Penn
Deep MACDH histogram troughs suggest that the soybean correction has more room to run.
Position: N/A
David Penn
Technical Writer for Technical Analysis of STOCKS & COMMODITIES magazine, Working-Money.com, and Traders.com Advantage.
PRINT THIS ARTICLE
SUPPORT & RESISTANCE
Bye-Bye Beans?
07/28/05 01:37:29 PMby David Penn
Deep MACDH histogram troughs suggest that the soybean correction has more room to run.
Position: N/A
| It's been almost two years since I last wrote about soybeans ("Grains Gone Wild," August 15, 2003; Traders.com Advantage). From some perspectives, it was a good time to shut up--and start buying. I noted in "Grains Gone Wild" that the upside for grains in general was promising, pointing out that all of the grains where moving from historically oversold conditions. But there's "promising" and then there's promising. And it was the latter that characterized what happened to grains beginning in the late summer of 2003. |
| Basis continuous futures, soybeans rallied from a little over $5.52 in August 2003, to a closing high of $10.52 in March 2004. |

|
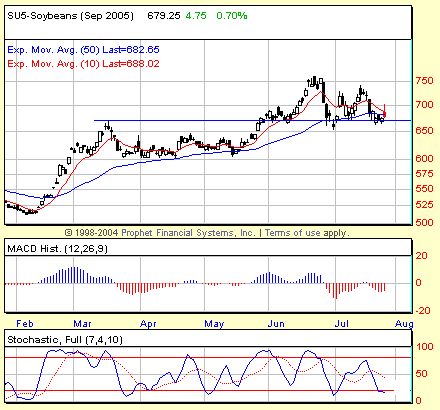
| Figure 1: A slipping September soybean contract finds support at the precise level of the May 2005 highs. |
| Graphic provided by: Prophet Financial, Inc. |
| |
| Unfortunately for bean bulls, what the market gave it swiftly took away as soybean futures plummeted in the spring and summer of 2004. The velocity of the crash was overwhelming: from a late March 2004 peak north of $10.62, soybean futures fell to $5.59 by mid-August. And it is in the wake of that crash that soybean futures--and those who would buy them--find themselves looking for reason to head higher once again. |
| True enough, soybeans have moved up since their lows during the fall of 2004, recently moving as high as $7.50 in June. And the trendline from the late 2004 lows remains largely--if not completely--intact. But beans have been under pressure since the second half of that month, losing a full dollar in a few weeks to find support around the $6.50 level. And part of that pressure has continued into late July, where September soybeans have closed four consecutive trading days below the aforementioned trendline. |
| Given the relative mildness of the trendline break, the most bearish sign in soybeans is the relative depth of its late June/early July MACD histogram. The low reading on this histogram represents a low for the entire life of the September soybean contract--it has never been lower. As such, it suggests strongly that the price lows accompanying that histogram extreme are vulnerable to being exceeded. The stochastic is very much "in gear" with price action, meaning that there is not yet the sort of positive divergence that would suggest the current, short-term downleg--which began in mid-July--has or is close to having reached a true bottom. |
Technical Writer for Technical Analysis of STOCKS & COMMODITIES magazine, Working-Money.com, and Traders.com Advantage.
| Title: | Technical Writer |
| Company: | Technical Analysis, Inc. |
| Address: | 4757 California Avenue SW |
| Seattle, WA 98116 | |
| Phone # for sales: | 206 938 0570 |
| Fax: | 206 938 1307 |
| Website: | www.Traders.com |
| E-mail address: | DPenn@traders.com |
Traders' Resource Links | |
| Charting the Stock Market: The Wyckoff Method -- Books | |
| Working-Money.com -- Online Trading Services | |
| Traders.com Advantage -- Online Trading Services | |
| Technical Analysis of Stocks & Commodities -- Publications and Newsletters | |
| Working Money, at Working-Money.com -- Publications and Newsletters | |
| Traders.com Advantage -- Publications and Newsletters | |
| Professional Traders Starter Kit -- Software | |
Click here for more information about our publications!
Comments
Date: 07/30/05Rank: 2Comment:

|

Request Information From Our Sponsors
- StockCharts.com, Inc.
- Candle Patterns
- Candlestick Charting Explained
- Intermarket Technical Analysis
- John Murphy on Chart Analysis
- John Murphy's Chart Pattern Recognition
- John Murphy's Market Message
- MurphyExplainsMarketAnalysis-Intermarket Analysis
- MurphyExplainsMarketAnalysis-Visual Analysis
- StockCharts.com
- Technical Analysis of the Financial Markets
- The Visual Investor
- VectorVest, Inc.
- Executive Premier Workshop
- One-Day Options Course
- OptionsPro
- Retirement Income Workshop
- Sure-Fire Trading Systems (VectorVest, Inc.)
- Trading as a Business Workshop
- VectorVest 7 EOD
- VectorVest 7 RealTime/IntraDay
- VectorVest AutoTester
- VectorVest Educational Services
- VectorVest OnLine
- VectorVest Options Analyzer
- VectorVest ProGraphics v6.0
- VectorVest ProTrader 7
- VectorVest RealTime Derby Tool
- VectorVest Simulator
- VectorVest Variator
- VectorVest Watchdog
