HOT TOPICS LIST
- MACD
- Fibonacci
- RSI
- Gann
- ADXR
- Stochastics
- Volume
- Triangles
- Futures
- Cycles
- Volatility
- ZIGZAG
- MESA
- Retracement
- Aroon
INDICATORS LIST
LIST OF TOPICS
PRINT THIS ARTICLE
by Koos van der Merwe
Many years ago when I was knee high to a grasshopper, I lay in the sun at a hotel swimming pool at a small town called Agatha in the Northern Transvaal of South Africa. Here, I opened my first, of what was to be many books, about WD Gann.
Position: Accumulate
Koos van der Merwe
Has been a technical analyst since 1969, and has worked as a futures and options trader with First Financial Futures in Johannesburg, South Africa.
PRINT THIS ARTICLE
GANN
Gann And The S&P 500 Index
07/28/05 01:43:31 PMby Koos van der Merwe
Many years ago when I was knee high to a grasshopper, I lay in the sun at a hotel swimming pool at a small town called Agatha in the Northern Transvaal of South Africa. Here, I opened my first, of what was to be many books, about WD Gann.
Position: Accumulate
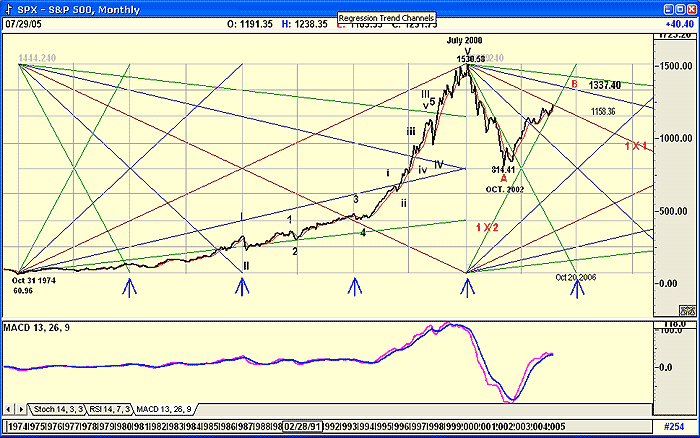
| The market research of WD Gann can be almost mystical, especially his astronomical charting. It turns many technical analysts away from his work, which is a pity because they lose a very interesting and precise analytical tool. Most programs today offer Gann fans as a standard, but few offer Gann squares, or Gann's division of a trading range. The chart below shows the fans plus the trading range, allowing for a more calculated forecast. |

|
| Gann Fans and the SPX. |
| Graphic provided by: AdvancedGET. |
| |
| Above is a monthly chart of the S&P 500 index from the low of 60.96 on October 31, 1974 to the high of 1530.58 in July 2000. The chart also highlights the fall to 814.41 in October 2002, and the subsequent rise taking place today. The question of course is, where is the S&P 500 going from here? I have drawn a Gann square from the low of 60.96 to the high of 814.41 and projected it forward. The chart takes the rise from 60.96 to 814.41 and divides it into eight levels that have acted as support and resistance points for the index. The chart also highlights the Gann fans by drawing vertical lines at the point where the fans crossed the horizontal drawn from the high and the low. The correlation between these turning points and the S&P highs is quite remarkable. This, therefore, allows me to project and predict forward moves with greater confidence. |
| So what does the chart forecast? At the moment, the index is finding resistance at the 1 x 1 line. Should it turn downwards, this will confirm the Elliott B-wave, suggesting that a C-wave down is in progress. On the chart however, I have shown the B-wave finalizing at the Gann square of October 20, 2006. This seems feasible, but because I still believe a B-wave is in progress, the ride will be volatile. The target suggested is 1337.40. Finally, the MACD indicator -- my most acceptable indicator on this chart -- although looking weak, has bounced off its moving average sell trigger, suggesting strength. Although the indicator as an oscillator may lag slightly, it has proven to be remarkably accurate in the past, so I'm sticking with it. |
| To conclude, the analysis of WD Gann applied to the S&P 500 index suggests a continued rise into October 2006, with support at 1158.36. The rise is hugging the 1 X 2 Gann fan with a break below this support line suggesting weakness ahead. |
Has been a technical analyst since 1969, and has worked as a futures and options trader with First Financial Futures in Johannesburg, South Africa.
| Address: | 3256 West 24th Ave |
| Vancouver, BC | |
| Phone # for sales: | 6042634214 |
| E-mail address: | petroosp@gmail.com |
Click here for more information about our publications!
Comments
Date: 07/28/05Rank: 5Comment:
Date: 07/30/05Rank: 3Comment:

Request Information From Our Sponsors
- VectorVest, Inc.
- Executive Premier Workshop
- One-Day Options Course
- OptionsPro
- Retirement Income Workshop
- Sure-Fire Trading Systems (VectorVest, Inc.)
- Trading as a Business Workshop
- VectorVest 7 EOD
- VectorVest 7 RealTime/IntraDay
- VectorVest AutoTester
- VectorVest Educational Services
- VectorVest OnLine
- VectorVest Options Analyzer
- VectorVest ProGraphics v6.0
- VectorVest ProTrader 7
- VectorVest RealTime Derby Tool
- VectorVest Simulator
- VectorVest Variator
- VectorVest Watchdog
- StockCharts.com, Inc.
- Candle Patterns
- Candlestick Charting Explained
- Intermarket Technical Analysis
- John Murphy on Chart Analysis
- John Murphy's Chart Pattern Recognition
- John Murphy's Market Message
- MurphyExplainsMarketAnalysis-Intermarket Analysis
- MurphyExplainsMarketAnalysis-Visual Analysis
- StockCharts.com
- Technical Analysis of the Financial Markets
- The Visual Investor
