HOT TOPICS LIST
- MACD
- Fibonacci
- RSI
- Gann
- ADXR
- Stochastics
- Volume
- Triangles
- Futures
- Cycles
- Volatility
- ZIGZAG
- MESA
- Retracement
- Aroon
INDICATORS LIST
LIST OF TOPICS
PRINT THIS ARTICLE
by David Penn
Do negative divergences anticipate a reversal in the Russell 2000?
Position: N/A
David Penn
Technical Writer for Technical Analysis of STOCKS & COMMODITIES magazine, Working-Money.com, and Traders.com Advantage.
PRINT THIS ARTICLE
STOCHASTICS
The Smaller They Come?
07/28/05 01:51:29 PMby David Penn
Do negative divergences anticipate a reversal in the Russell 2000?
Position: N/A
| When I grow up, I want to be a small-cap stock. |
| What's not to love about these stocks? Boundless opportunity before them, dreams of endless growth, the occasional celebrity appearance in Investor's Business Daily , but otherwise quietly tucked away in money-making, semi-anonymity.... When the other major averages are making euphemistic highs "for the move," small-cap stock indexes like the Russell 2000 that are chock-full of small-cap stocks are making all-time highs. No relative qualifications here. When the Russell 2000 says "new highs," you know it means it. |

|
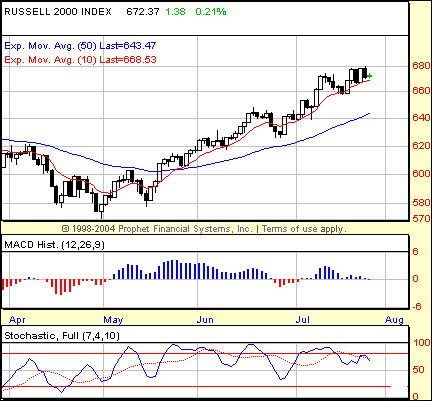
| Figure 1: A negative stochastic divergence in July 2005 suggests at least a pullback for the fortress of small-cap stocks known as the Russell 2000. |
| Graphic provided by: Prophet Financial, Inc. |
| |
| But markets are markets and, to steal a line from the US commander-in-chief, "they go up and they go down." And after nearly three months of going up, the great Russell 2000 looks as likely to close down its spring/summer bull campaign as it has in years. The sign of the (end of) times is again the negative stochastic divergence. Note how the price peak in early July is lower than the one in late July. At the same time, the corresponding stochastic peaks are higher, then lower. In other words, there are higher highs in price, but lower highs in the stochastic. The Russell 2000 is displaying a classic negative stochastic divergence. This suggests, at minimum, a pullback and, at maximum, a full reversal. True enough, the Russell 2000 has powered away from the darker implications of negative stochastic divergences in the recent past. There was a month-on-month negative divergence earlier in the summer, between the June and July 2005 highs, that helped cause the sour ending in July. That sour ending, however, turned out to be little more than a buying opportunity as the small caps rallied, taking out the July highs only a few days into August 2005. |

|
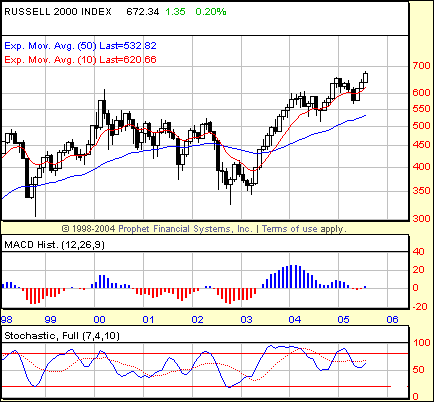
| Figure 2: On this monthly chart of the Russell 2000, the negative stochastic divergence is joined by a negative MACD histogram divergence. Both suggest that a correction of some significance could be right around the corner. |
| Graphic provided by: Prophet Financial, Inc. |
| |
| As such, I wouldn't be surprised to see the Russell 2000 move higher in the immediate term (one interesting milepost: Congress begins its recess this Friday). But a look at a longer-term chart of the $RUT suggests that a move higher might only underscore the increasing likelihood that the Russell 2000 might reverse. The monthly chart in Figure 2 shows how precarious things have become for the Russell 2000. First, let's go back to the 1999-2000 time frame at the far left-hand side of the chart. Notice how the stochastic peak in 1999 is higher than the one in early 2000? Notice how at the same time the price peak in 1999 is lower than the one in early 2000? Again, the chart presents a classic negative divergence -- only now at the monthly time frame, which suggests something more than a little pullback. Of course, what followed was the severe 2000-2003 cyclical bear market, which saw the Russell 2000 lose more than 37% in the three years from its closing monthly high in February 2000 to its closing monthly low in February 2003. |
| Now let's move to the opposite side of the chart. Notice how the stochastic peak in the middle of 2003 towers over the stochastic peak in early 2005? Notice how at the same time the price peak in middle 2003 is lower than the one in early 2005? The conclusion is hard to avoid: the Russell 2000 has developed another classic negative stochastic divergence on the monthly time frame. The only difference between this negative stochastic divergence and the one previously mentioned is that the first negative divergence -- the one that anticipated the 2000-2003 bear market -- was a year-on-year divergence involving two years. The present negative divergence encompasses three years, from 2003 to 2005. My suspicion is that if the negative stochastic divergence in the Russell 2000 is confirmed, the bear market that the divergence is currently anticipating will be at least as severe, if not more so, than the one anticipated by the relatively shorter-duration negative stochastic divergence back in 1999-2000. |
Technical Writer for Technical Analysis of STOCKS & COMMODITIES magazine, Working-Money.com, and Traders.com Advantage.
| Title: | Technical Writer |
| Company: | Technical Analysis, Inc. |
| Address: | 4757 California Avenue SW |
| Seattle, WA 98116 | |
| Phone # for sales: | 206 938 0570 |
| Fax: | 206 938 1307 |
| Website: | www.Traders.com |
| E-mail address: | DPenn@traders.com |
Traders' Resource Links | |
| Charting the Stock Market: The Wyckoff Method -- Books | |
| Working-Money.com -- Online Trading Services | |
| Traders.com Advantage -- Online Trading Services | |
| Technical Analysis of Stocks & Commodities -- Publications and Newsletters | |
| Working Money, at Working-Money.com -- Publications and Newsletters | |
| Traders.com Advantage -- Publications and Newsletters | |
| Professional Traders Starter Kit -- Software | |
Click here for more information about our publications!
Comments
Date: 07/30/05Rank: 4Comment:
Date: 07/30/05Rank: 5Comment:

Request Information From Our Sponsors
- StockCharts.com, Inc.
- Candle Patterns
- Candlestick Charting Explained
- Intermarket Technical Analysis
- John Murphy on Chart Analysis
- John Murphy's Chart Pattern Recognition
- John Murphy's Market Message
- MurphyExplainsMarketAnalysis-Intermarket Analysis
- MurphyExplainsMarketAnalysis-Visual Analysis
- StockCharts.com
- Technical Analysis of the Financial Markets
- The Visual Investor
- VectorVest, Inc.
- Executive Premier Workshop
- One-Day Options Course
- OptionsPro
- Retirement Income Workshop
- Sure-Fire Trading Systems (VectorVest, Inc.)
- Trading as a Business Workshop
- VectorVest 7 EOD
- VectorVest 7 RealTime/IntraDay
- VectorVest AutoTester
- VectorVest Educational Services
- VectorVest OnLine
- VectorVest Options Analyzer
- VectorVest ProGraphics v6.0
- VectorVest ProTrader 7
- VectorVest RealTime Derby Tool
- VectorVest Simulator
- VectorVest Variator
- VectorVest Watchdog
