HOT TOPICS LIST
- MACD
- Fibonacci
- RSI
- Gann
- ADXR
- Stochastics
- Volume
- Triangles
- Futures
- Cycles
- Volatility
- ZIGZAG
- MESA
- Retracement
- Aroon
INDICATORS LIST
LIST OF TOPICS
PRINT THIS ARTICLE
by David Penn
A reversal pattern develops after two months of gains in the gaming stock.
Position: N/A
David Penn
Technical Writer for Technical Analysis of STOCKS & COMMODITIES magazine, Working-Money.com, and Traders.com Advantage.
PRINT THIS ARTICLE
HEAD & SHOULDERS
A Head And Shoulders Top In IGT
07/28/05 12:36:14 PMby David Penn
A reversal pattern develops after two months of gains in the gaming stock.
Position: N/A
| Among a number of unattractive gaming stocks, International Game Technology truly sticks out. Though there are a few casino and gambling stocks--like Kerzner International (KZL)--that barely recovered from their early 2005 swoon and now look vulnerable to a rollover, and a few others--like Ameristar Casinos (ASCA)--that have held up well over most of 2005 but now also appear toppy, International Game Technology (IGT) has a combination of both "sex appeal" (read: name recognition) and technical portents that makes it worth highlighting in any conversation about gaming stocks. |
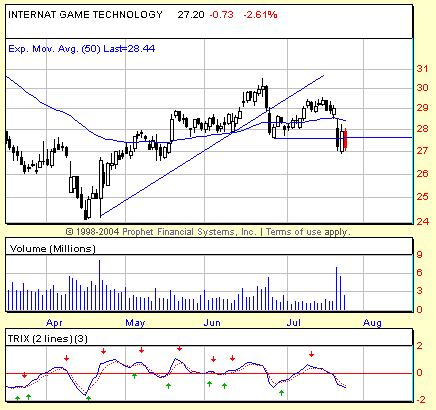
| Some context for IGT might be helpful. The April 2005 low seen in Figure 1 is the final chapter in a bearish story that began fully a year ago, when shares of IGT topped out near $47. Between then and now, IGT had fallen from $47 in April 2004 to a low just south of $30 in August 2004. From these levels, IGT was buoyed by the bullishness of the broader market, which took IGT as high as $37 in early November. It was the November peak (or "peak-lette") that began the downslide that led the recent lows in April. |

|
| Figure 1: The break below the 50-day exponential moving average in late July confirms the TRIX sell signal from a few days before (note the red arrow in July). |
| Graphic provided by: Prophet Financial, Inc. |
| |
| There are two compelling technical reasons for traders and investors in IGT to be cautious in the near-term. The first is the most basic: the late June trendline break and subsequent 1-2-3 trend reversal in July. The second is the head and shoulders top which, stretching from just under 28 to just over 30, threatens to send IGT back to a test of its April 2004 lows. |
| First, the trendline reversal. Note how IGT broke down below its two-month trendline in late June, then rallied back in an effort to re-establish the uptrend in mid-July, only to break down again in late July, taking out the lows of the initial trendline break. This three-step process essentially sums up how the 1-2-3 trend reversal works. Prices first must break through a trendline. Second, prices must attempt to re-established the previous trend. Third and lastly, prices must fail to set a new price extreme (high or low) during step two and, instead, reverse back in the direction of the trendline break and take out the price extreme (high or low) of that initial break. IGT, so far, has not only completed all three steps, but has completed the final step on overwhelming volume. |
| Second it the head and shoulders top. This pattern is no less clear than the 1-2-3 trendline break. The pattern begins in mid-May, where the left shoulder is formed. The head of the head and shoulders top developed over the course of June, and the right shoulder begin very late in June and is completely formed by late July. As with the third step of the 1-2-3 trend reversal mentioned above, the final step of a head and shoulders top--the breakout--has also arrived with strong volume. But unlike the 1-2-3 trend reversal, the head and shoulders top does provide some sense of what's next. Namely, the pattern size of the head and shoulders top, approximately 2.25 points, subtracted from the level at the breakdown from the pattern suggests a minimum downside objective of about 25.5--not much more than a point or two away from International Game Technology's April 2005 lows. |
Technical Writer for Technical Analysis of STOCKS & COMMODITIES magazine, Working-Money.com, and Traders.com Advantage.
| Title: | Technical Writer |
| Company: | Technical Analysis, Inc. |
| Address: | 4757 California Avenue SW |
| Seattle, WA 98116 | |
| Phone # for sales: | 206 938 0570 |
| Fax: | 206 938 1307 |
| Website: | www.Traders.com |
| E-mail address: | DPenn@traders.com |
Traders' Resource Links | |
| Charting the Stock Market: The Wyckoff Method -- Books | |
| Working-Money.com -- Online Trading Services | |
| Traders.com Advantage -- Online Trading Services | |
| Technical Analysis of Stocks & Commodities -- Publications and Newsletters | |
| Working Money, at Working-Money.com -- Publications and Newsletters | |
| Traders.com Advantage -- Publications and Newsletters | |
| Professional Traders Starter Kit -- Software | |
Click here for more information about our publications!
Comments
Date: 07/30/05Rank: 3Comment:

Request Information From Our Sponsors
- StockCharts.com, Inc.
- Candle Patterns
- Candlestick Charting Explained
- Intermarket Technical Analysis
- John Murphy on Chart Analysis
- John Murphy's Chart Pattern Recognition
- John Murphy's Market Message
- MurphyExplainsMarketAnalysis-Intermarket Analysis
- MurphyExplainsMarketAnalysis-Visual Analysis
- StockCharts.com
- Technical Analysis of the Financial Markets
- The Visual Investor
- VectorVest, Inc.
- Executive Premier Workshop
- One-Day Options Course
- OptionsPro
- Retirement Income Workshop
- Sure-Fire Trading Systems (VectorVest, Inc.)
- Trading as a Business Workshop
- VectorVest 7 EOD
- VectorVest 7 RealTime/IntraDay
- VectorVest AutoTester
- VectorVest Educational Services
- VectorVest OnLine
- VectorVest Options Analyzer
- VectorVest ProGraphics v6.0
- VectorVest ProTrader 7
- VectorVest RealTime Derby Tool
- VectorVest Simulator
- VectorVest Variator
- VectorVest Watchdog
