HOT TOPICS LIST
- MACD
- Fibonacci
- RSI
- Gann
- ADXR
- Stochastics
- Volume
- Triangles
- Futures
- Cycles
- Volatility
- ZIGZAG
- MESA
- Retracement
- Aroon
INDICATORS LIST
LIST OF TOPICS
PRINT THIS ARTICLE
by David Penn
A consolidation early in June sets the stage for a Nasdaq rally in July.
Position: N/A
David Penn
Technical Writer for Technical Analysis of STOCKS & COMMODITIES magazine, Working-Money.com, and Traders.com Advantage.
PRINT THIS ARTICLE
THE DIAMOND
Nasdaq's Diamond Breakout
07/28/05 12:09:33 PMby David Penn
A consolidation early in June sets the stage for a Nasdaq rally in July.
Position: N/A
| They say that a good diamond is hard enough to cut glass. Something similar could be said about a good diamond consolidation: its breakout should be strong enough to cut through days, weeks or even months worth of meandering price action. |
| Diamonds truly are technical gifts for all occasions, showing up on all time frames from intraday to monthly, and appearing as part of both trend-ending (such as a top or bottom formation) as well as trend-extending (as in consolidation or "trading range") moves in prices. |

|
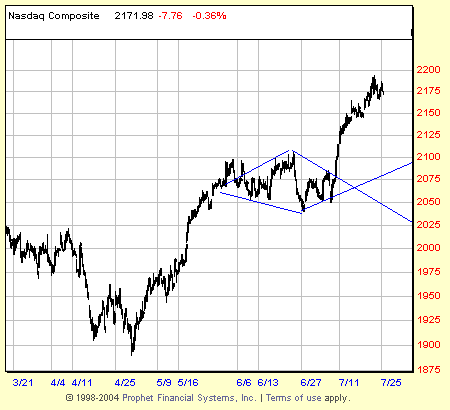
| Figure 1: This diamond consolidation in early June provided those already long with the opportunity to take profits. Meanwhile, those looking to get in found in the diamond a sturdy base from which to anticipate further gains. |
| Graphic provided by: Prophet Financial, Inc. |
| |
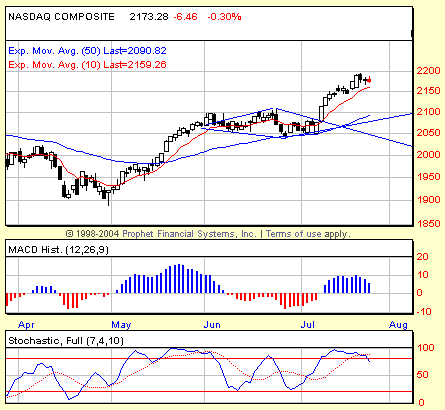
| Determining if a diamond pattern is part of a trend-ending or trend-extending process can be difficult. One thing that can often be helpful is to use indicators to spot, for example, positive or negative divergences that might tip off the near-term direction of any breakout. About a month ago in an article for Traders.com Advantage ("Intraday Diamonds and Divergences," June 28, 2005), I pointed out an example of a diamond pattern that had within it a positive stochastic divergence. This "tell" tilted the odds in favor of a bottoming (trend-ending) diamond as opposed to a continuation (trend-extending) diamond--which is precisely what the intraday diamond in late June proved to be. Unfortunately, as the chart in Figure 2 shows, there were precious few technical clues as to the near-term direction of any breakout from this diamond. Some daily charts showed a small, but real, positive stochastic divergence between the dip in early June and the lower low near mid-month. But others either did not or were more equivocal in their stochastic readings. As far as divergence-based clues, there were no sound clues to pursue. In fact, an argument could have been made that rather than a positive stochastic divergence suggesting higher prices, there was a negative stochastic divergence between the late May and mid-June peaks that could have suggested that it was lower prices that were more likely. |

|
| Figure 2: The positive stochastic divergence was likely too close to call for many traders in late June. But the support provided by the 50-day exponential moving average (in blue) was clear as a bell. |
| Graphic provided by: Prophet Financial, Inc. |
| |
| However, the general market environment might have played enough of a role to keep Nasdaq traders on the right course. Note that during the consolidation, negative stochastic divergence not withstanding, the Nasdaq never closed below the 50-day exponential moving average. As a matter of fact, downside penetration of the day--even on an intraday basis--was extremely limited during the consolidation to a single day. And that day was a doji--providing enough caution to keep both bulls and bears from getting too much ahead of themselves. |
| Recall that a doji--or "spinning top"--is considered a neutral sign, a suggestion that the bulls and bears are evenly matched. In the context of the downward reversal from the mid-June peak that occurred only two days before the doji or spinning top--to say nothing of its ability to hold support at the 50-day EMA--was a strong warning that the short side of the Nasdaq might be more treacherous than it appeared a few days before. The breakout from the diamond was clean, without even the slightest pullback. Given the size of the diamond at just over 50 points, and a breakout level at about 2075, traders could have anticipated a minimum upside move to about 2125--which the Nasdaq reached without a hitch. Progress north of this level, predictably, has been harder to come by, with the Nasdaq struggling somewhat to clear 2150 and an even greater struggle to take and hold 2200 looming only a few points away. |
Technical Writer for Technical Analysis of STOCKS & COMMODITIES magazine, Working-Money.com, and Traders.com Advantage.
| Title: | Technical Writer |
| Company: | Technical Analysis, Inc. |
| Address: | 4757 California Avenue SW |
| Seattle, WA 98116 | |
| Phone # for sales: | 206 938 0570 |
| Fax: | 206 938 1307 |
| Website: | www.Traders.com |
| E-mail address: | DPenn@traders.com |
Traders' Resource Links | |
| Charting the Stock Market: The Wyckoff Method -- Books | |
| Working-Money.com -- Online Trading Services | |
| Traders.com Advantage -- Online Trading Services | |
| Technical Analysis of Stocks & Commodities -- Publications and Newsletters | |
| Working Money, at Working-Money.com -- Publications and Newsletters | |
| Traders.com Advantage -- Publications and Newsletters | |
| Professional Traders Starter Kit -- Software | |
Click here for more information about our publications!
Comments
Date: 07/30/05Rank: 3Comment:

Request Information From Our Sponsors
- StockCharts.com, Inc.
- Candle Patterns
- Candlestick Charting Explained
- Intermarket Technical Analysis
- John Murphy on Chart Analysis
- John Murphy's Chart Pattern Recognition
- John Murphy's Market Message
- MurphyExplainsMarketAnalysis-Intermarket Analysis
- MurphyExplainsMarketAnalysis-Visual Analysis
- StockCharts.com
- Technical Analysis of the Financial Markets
- The Visual Investor
- VectorVest, Inc.
- Executive Premier Workshop
- One-Day Options Course
- OptionsPro
- Retirement Income Workshop
- Sure-Fire Trading Systems (VectorVest, Inc.)
- Trading as a Business Workshop
- VectorVest 7 EOD
- VectorVest 7 RealTime/IntraDay
- VectorVest AutoTester
- VectorVest Educational Services
- VectorVest OnLine
- VectorVest Options Analyzer
- VectorVest ProGraphics v6.0
- VectorVest ProTrader 7
- VectorVest RealTime Derby Tool
- VectorVest Simulator
- VectorVest Variator
- VectorVest Watchdog
