

HOT TOPICS LIST
- MACD
- Fibonacci
- RSI
- Gann
- ADXR
- Stochastics
- Volume
- Triangles
- Futures
- Cycles
- Volatility
- ZIGZAG
- MESA
- Retracement
- Aroon
INDICATORS LIST
LIST OF TOPICS
PRINT THIS ARTICLE
by David Penn
The war between pharma and biotech looks to claim another victim.
Position: N/A
David Penn
Technical Writer for Technical Analysis of STOCKS & COMMODITIES magazine, Working-Money.com, and Traders.com Advantage.
PRINT THIS ARTICLE
REVERSAL
Abbott Labs Awesome 2B Top
07/26/05 01:51:37 PMby David Penn
The war between pharma and biotech looks to claim another victim.
Position: N/A
| As exciting as technical analysis is, no one makes better stories than the fundamentalists. A case in point is Jim Cramer's exegesis on the shifting balance of power between the "chemical drugs" made by traditional pharmaceutical companies and the new wave of "biological drugs" made by upstart biotechnology companies. |
| I have no idea if Cramer knows what he's talking about, but any stock story that resurrects the memory of "BUNCH"--the glamour tech stocks of the 1970s (Burroughs, UNIVAC, NCR, Control Data Corporation, and Honeywell)--as a metaphor for the current crop of "Big Pharma" stocks--is clever enough to be worth my attention. |
|
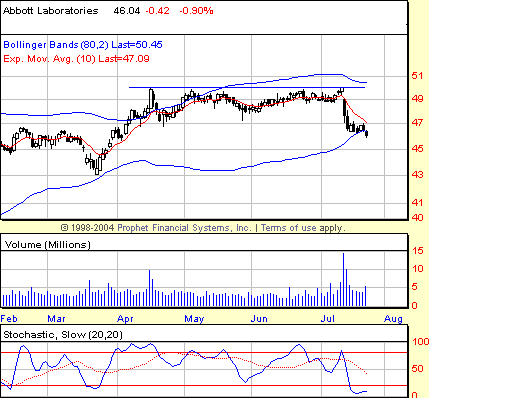
| A rendezvous with the lower band of its 80-day Bollinger band, and a deeply oversold stochastic could be anticipating additional declines for the drug maker. |
| Graphic provided by: Prophet Financial, Inc. |
| |
| I don't know if Abbott Labs is part of what Cramer had in mind when he talked about stodgy old pharmaceutical companies that were past their prime but the technician in me sees a stock in ABT that may be seeing its best days via rear-view mirror. There are two dominant technical features in the daily chart of Abbott Labs in Figure 1. The first is the 2B top between the highs of April and the highs of July. As a 2B top, this one is a squeaker, with an April high of 49.98 and a July high of 50.00. But the fact of the matter is that a higher high was made in July (vis-a-vis April) and the follow-through to the upside from that July high--as the chart in Figure 1 makes plain--was worse than non-existent. It was an outright, gap down reversal. |
| Trading a 2B top means an entry at the level of the low of the initial high. In this case, that would be at the low of the same day as the April high, or about 48.29. A 2B trader in July looking to short ABT would have been able to take a position during the sharp downdraft of July 13th. However, there may be additional opportunities for those interested in looking at ABT through bear-colored lenses. Note how ABT has fallen into "oversold" territory in mid-July. This happened at about the same time that the stock began testing the lower band of its 80-day Bollinger bands. From one perspective, this would suggest that ABT is likely to bounce from these levels in an effort to relieve both the oversold condition as well as to move back away from its excursion beyond the second standard deviation (as reflected by the long-term Bollinger bands. |
| However, from another perspective--the perspective that reminds us that, that which is oversold often becomes even more oversold--ABT presents an interesting short at these levels, as well as being below the Bollinger bands. The stock was "officially" oversold on July 15, when the stochastic dropped below 20. The first close beneath the low of the 15th occurred on July 19th, which can be considered confirmation or merely follow-through from the "sell signal" of July 15th. While not identical, this use of the Bollinger bands and the stochastic is derived largely from insights shared recently by Price Headley of Big Trends during a seminar at the Chicago Trader's Expo. Those particularly curious about Headley's full strategy are encouraged to track it and him down at bigtrends.com. In the meanwhile, ABT has broken down beneath short-term support at about 46.25 as of the end of day on Friday, July 22. With the next clear-cut support at about 43, traders should not be surprised if Abbott Labs rides the "too low to be sold" train all the way down. |
Technical Writer for Technical Analysis of STOCKS & COMMODITIES magazine, Working-Money.com, and Traders.com Advantage.
| Title: | Technical Writer |
| Company: | Technical Analysis, Inc. |
| Address: | 4757 California Avenue SW |
| Seattle, WA 98116 | |
| Phone # for sales: | 206 938 0570 |
| Fax: | 206 938 1307 |
| Website: | www.Traders.com |
| E-mail address: | DPenn@traders.com |
Traders' Resource Links | |
| Charting the Stock Market: The Wyckoff Method -- Books | |
| Working-Money.com -- Online Trading Services | |
| Traders.com Advantage -- Online Trading Services | |
| Technical Analysis of Stocks & Commodities -- Publications and Newsletters | |
| Working Money, at Working-Money.com -- Publications and Newsletters | |
| Traders.com Advantage -- Publications and Newsletters | |
| Professional Traders Starter Kit -- Software | |
Click here for more information about our publications!
Comments
Date:�07/30/05Rank:�3Comment:�

Request Information From Our Sponsors
- StockCharts.com, Inc.
- Candle Patterns
- Candlestick Charting Explained
- Intermarket Technical Analysis
- John Murphy on Chart Analysis
- John Murphy's Chart Pattern Recognition
- John Murphy's Market Message
- MurphyExplainsMarketAnalysis-Intermarket Analysis
- MurphyExplainsMarketAnalysis-Visual Analysis
- StockCharts.com
- Technical Analysis of the Financial Markets
- The Visual Investor
- VectorVest, Inc.
- Executive Premier Workshop
- One-Day Options Course
- OptionsPro
- Retirement Income Workshop
- Sure-Fire Trading Systems (VectorVest, Inc.)
- Trading as a Business Workshop
- VectorVest 7 EOD
- VectorVest 7 RealTime/IntraDay
- VectorVest AutoTester
- VectorVest Educational Services
- VectorVest OnLine
- VectorVest Options Analyzer
- VectorVest ProGraphics v6.0
- VectorVest ProTrader 7
- VectorVest RealTime Derby Tool
- VectorVest Simulator
- VectorVest Variator
- VectorVest Watchdog