

HOT TOPICS LIST
- MACD
- Fibonacci
- RSI
- Gann
- ADXR
- Stochastics
- Volume
- Triangles
- Futures
- Cycles
- Volatility
- ZIGZAG
- MESA
- Retracement
- Aroon
INDICATORS LIST
LIST OF TOPICS
PRINT THIS ARTICLE
by David Penn
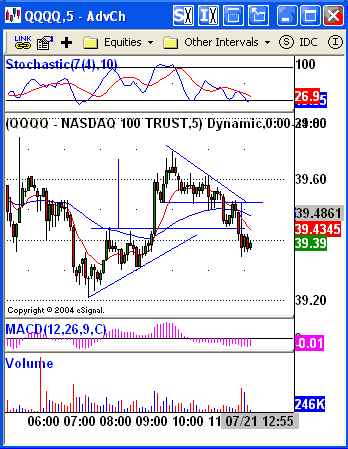
The five-minute chart reveals how a pair of triangles, the first ascending and the second descending, anticipated a day's worth of market movement.
Position: N/A
David Penn
Technical Writer for Technical Analysis of STOCKS & COMMODITIES magazine, Working-Money.com, and Traders.com Advantage.
PRINT THIS ARTICLE
TRIANGLES
Intraday Dueling Triangles
07/28/05 11:40:40 AMby David Penn
The five-minute chart reveals how a pair of triangles, the first ascending and the second descending, anticipated a day's worth of market movement.
Position: N/A
| Think chart patterns are fun? How about two chart patterns in one day? How about two chart patterns that are one-day? |
| On July 21, the markets sold off early. This was due largely to the four-year highs reached in many markets, such as the S&P 500, the day before, but also because of anxieties stoked by the second (albeit milder in terms of casualties) terrorist bombing in two weeks of buses and subway stations in London. |
|
| An ascending triangle bottom in the morning begets a descending triangle top in the afternoon. |
| Graphic provided by: eSignal. |
| |
| But the bounce was swift in coming, as shown by the five-minute chart of the QQQQ shown above. By the early morning, the QQQQ was fully in bounce mode. And look at the form that the short-term bottom and subsequent bounce made. While ascending triangles are more typically discovered as components of upwardly trending markets, the phenomenon of ascending triangles that are reversals -- in this case both a bottom and a reversal pattern -- is not unheard of. What is especially interesting about the ascending triangle bottom in the chart shown above is that its minimum upside projection is met perfectly -- and that meeting begets, eventually, another directional triangle. In this case, the second directional triangle is of the descending variety and anticipates a break to the downside. That break, from a triangle that is almost exactly the same size as the previous ascending triangle from the morning, saw the five-minute QQQQ fall back to just below the level of the breakout from the morning's ascending triangle. |
| While patterns and moves like this can be difficult to capture in real time, they do remind us of the effectiveness of chart patterns. In both instances, the breakout projections were reached as expected, even as their respective breakouts took slightly different paths out and away from the triangle patterns. In the first case, the breakout was almost a straight shot to the upside price objective. In the second case, the breakdown moved about halfway to the downside objective before pulling back to test the breakdown level and then resuming the descent. |
| So the next time you hear people talking about a market that "ain't going nowhere," be wary of getting caught in their slow-moving timeframe. There might be a whole lot of shaking going on underneath. |
Technical Writer for Technical Analysis of STOCKS & COMMODITIES magazine, Working-Money.com, and Traders.com Advantage.
| Title: | Technical Writer |
| Company: | Technical Analysis, Inc. |
| Address: | 4757 California Avenue SW |
| Seattle, WA 98116 | |
| Phone # for sales: | 206 938 0570 |
| Fax: | 206 938 1307 |
| Website: | www.Traders.com |
| E-mail address: | DPenn@traders.com |
Traders' Resource Links | |
| Charting the Stock Market: The Wyckoff Method -- Books | |
| Working-Money.com -- Online Trading Services | |
| Traders.com Advantage -- Online Trading Services | |
| Technical Analysis of Stocks & Commodities -- Publications and Newsletters | |
| Working Money, at Working-Money.com -- Publications and Newsletters | |
| Traders.com Advantage -- Publications and Newsletters | |
| Professional Traders Starter Kit -- Software | |
Click here for more information about our publications!
Comments
Date:�07/30/05Rank:�3Comment:�

Request Information From Our Sponsors
- StockCharts.com, Inc.
- Candle Patterns
- Candlestick Charting Explained
- Intermarket Technical Analysis
- John Murphy on Chart Analysis
- John Murphy's Chart Pattern Recognition
- John Murphy's Market Message
- MurphyExplainsMarketAnalysis-Intermarket Analysis
- MurphyExplainsMarketAnalysis-Visual Analysis
- StockCharts.com
- Technical Analysis of the Financial Markets
- The Visual Investor
- VectorVest, Inc.
- Executive Premier Workshop
- One-Day Options Course
- OptionsPro
- Retirement Income Workshop
- Sure-Fire Trading Systems (VectorVest, Inc.)
- Trading as a Business Workshop
- VectorVest 7 EOD
- VectorVest 7 RealTime/IntraDay
- VectorVest AutoTester
- VectorVest Educational Services
- VectorVest OnLine
- VectorVest Options Analyzer
- VectorVest ProGraphics v6.0
- VectorVest ProTrader 7
- VectorVest RealTime Derby Tool
- VectorVest Simulator
- VectorVest Variator
- VectorVest Watchdog